Market Sentiment
Understand the tone of what's being said about your company — from individual posts to platform-wide trends.
Sentiment Scoring
Each activity receives a sentiment score from -1 to +1, calculated using machine learning models trained on financial communications.
Sentiment scoring reads the tone of a post, article, or discussion and rates it on a scale. A bullish forum thread might score +0.6. A neutral news article might score 0.0. A bearish analyst comment might score -0.5.
| Score Range | Label | Meaning |
|---|---|---|
| > 0.1 | Positive | Favourable tone, bullish language |
| -0.1 to 0.1 | Neutral | Factual, neither positive nor negative |
| -0.3 to -0.1 | Lacking | Slightly negative, cautious tone |
| < -0.3 | Negative | Unfavourable tone, bearish language |
Aggregation
Sentiment rolls up at multiple levels, so you can zoom in or out:
| Level | How It's Calculated |
|---|---|
| Activity | Individual score for a single post or article |
| Author | Average across all their activities |
| Announcement | Average of all linked activities |
| Period | Average across all activities in the selected date range |
Sentiment by Source
Different platforms tend toward different sentiment distributions:
| Platform | Typical Pattern |
|---|---|
| Forums | More polarised — strong opinions, both bullish and bearish |
| Wide range — depends on author type and context | |
| Generally more neutral and professional | |
| Media | Typically neutral — factual reporting tone |
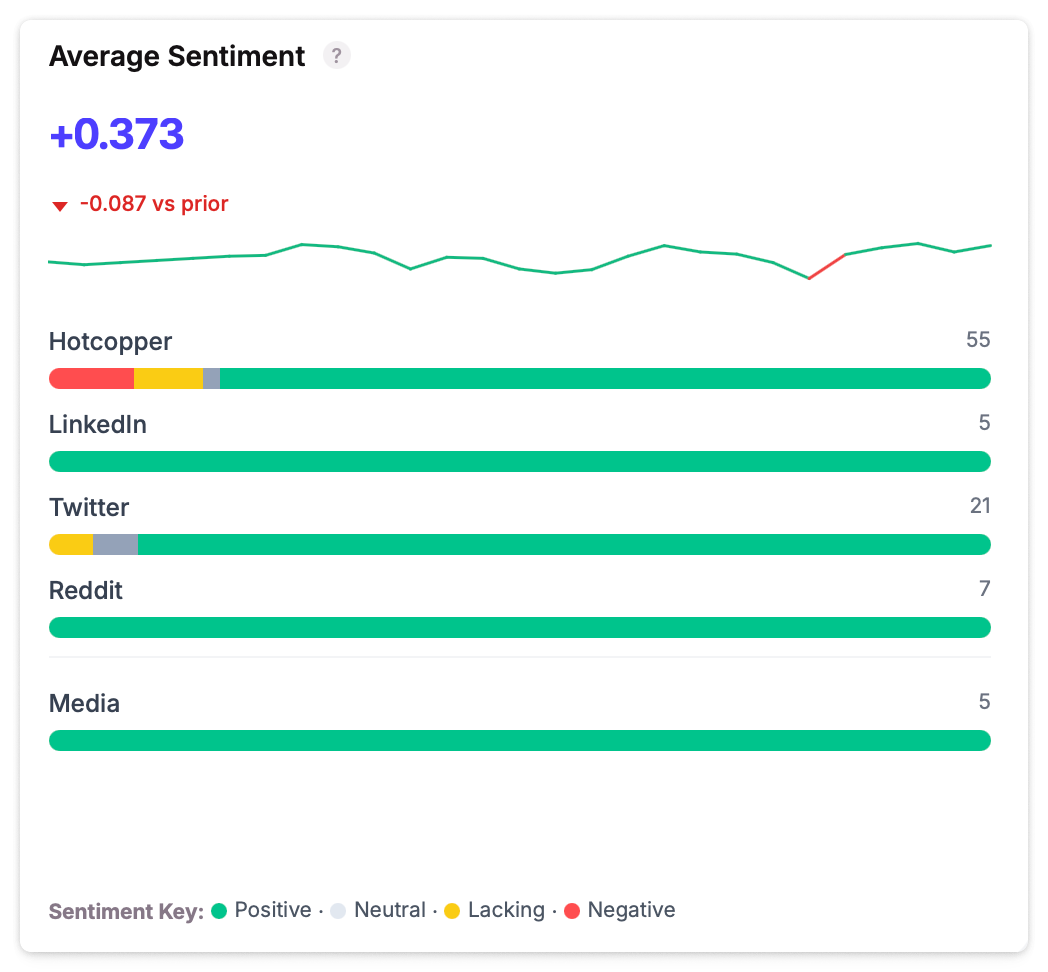
The Dashboard sentiment by source chart helps you identify platform-specific patterns at a glance.
Where Sentiment Appears
Sentiment is surfaced throughout the platform:
| Location | What You'll See |
|---|---|
| Activities grid | Colour-coded sentiment indicator on each row |
| Activity detail | Score with positive/negative/neutral label |
| Announcements grid | Average sentiment across linked activities |
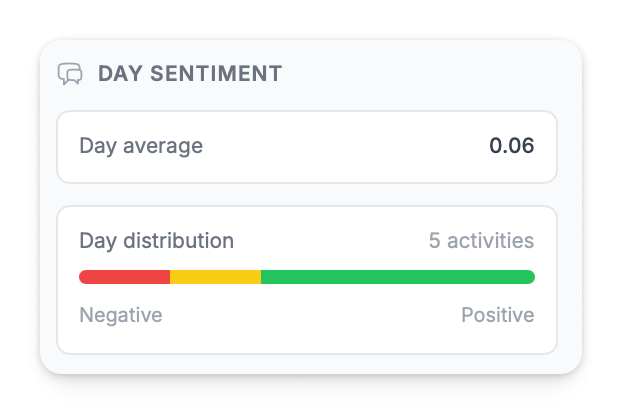
| Announcement detail | Sentiment distribution breakdown |
| People grid | Average sentiment per author |
| Dashboard | Sentiment distribution by source |
| Reports | Sentiment breakdown and trends |
| Alerts | Trigger on sentiment thresholds |
Using Sentiment Data
Monitor shifts: Sudden sentiment changes may signal emerging issues or opportunities. A sharp negative shift without a corresponding announcement is worth investigating.
Correlate with price: Compare sentiment trends with share price movements. Sustained negative sentiment sometimes precedes price drops — and vice versa.
Identify outliers: Activities with extreme sentiment (positive or negative) often warrant closer attention. Use the Activities filter to surface them.
Track authors: Authors with consistently extreme sentiment may be influential voices. See People for author-level analysis.
Don't just look at the average — look at the distribution. A neutral average can mask a split between strongly positive and strongly negative sentiment, which tells a very different story.