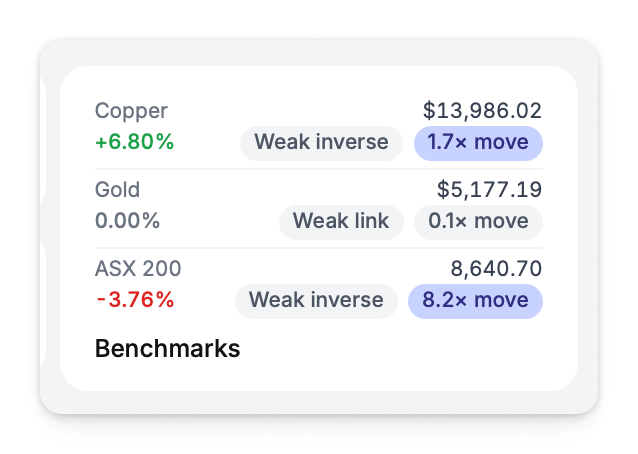
Correlation & Beta
How tightly your share price tracks a chosen benchmark, and how big the moves should be relative to it. Two separate questions, two separate numbers — r and β.
What Is Correlation
Correlation measures how closely your share price moves with a benchmark — either a commodity or an index — over time.
A Pearson correlation coefficient ranging from -1 to +1 showing how closely two variables move together. +1 means perfect lockstep; 0 means no relationship; -1 means perfect opposite.
How Correlation Works
The platform calculates day-by-day returns for both your stock and the selected benchmark, then computes the Pearson correlation over a rolling window (default: 90 days).
| Correlation | Meaning |
|---|---|
| +0.7 to +1.0 | Strong positive – moves in lockstep with benchmark |
| +0.4 to +0.7 | Moderate positive – generally follows benchmark |
| -0.4 to +0.4 | Weak/none – other factors driving price |
| -0.7 to -0.4 | Moderate negative – tends to move opposite |
| -1.0 to -0.7 | Strong negative – moves opposite to benchmark |
Beta (β) — Sensitivity
Where correlation tells you how tightly the stock and benchmark move together, beta tells you how much the stock moves on average for each 1% benchmark move. It's the slope of the linear regression and is what CAPM uses to compute expected return.
| Beta | Meaning |
|---|---|
| β > 1.5 | High volatility – moves more than 1.5× the benchmark |
| β = 1.0 to 1.5 | Above average – more volatile than the benchmark |
| β = 0.5 to 1.0 | Moderate – moves with the benchmark, slightly less volatile |
| β = 0 to 0.5 | Low volatility – relatively independent of the benchmark |
| β < 0 | Inverse – moves opposite to the benchmark |
r and β answer different questions. r tells you whether a benchmark is a meaningful reference at all (is the relationship tight, or is it noise?). β tells you how big the move should be when the benchmark does move. A stock can have low r and high β, or high r and low β — they're independent. Both are needed to interpret abnormal returns sensibly.
Additional metric calculated:
- R-squared – Variance explained by the benchmark
What Correlation Tells You
High correlation means your share price closely follows the benchmark. For a gold miner, high correlation with gold price is expected — the market treats you as a gold proxy.
Low correlation means other factors are influencing your price beyond the commodity or index:
- Company-specific news
- Management changes
- Operational issues
- Market sentiment about your company specifically
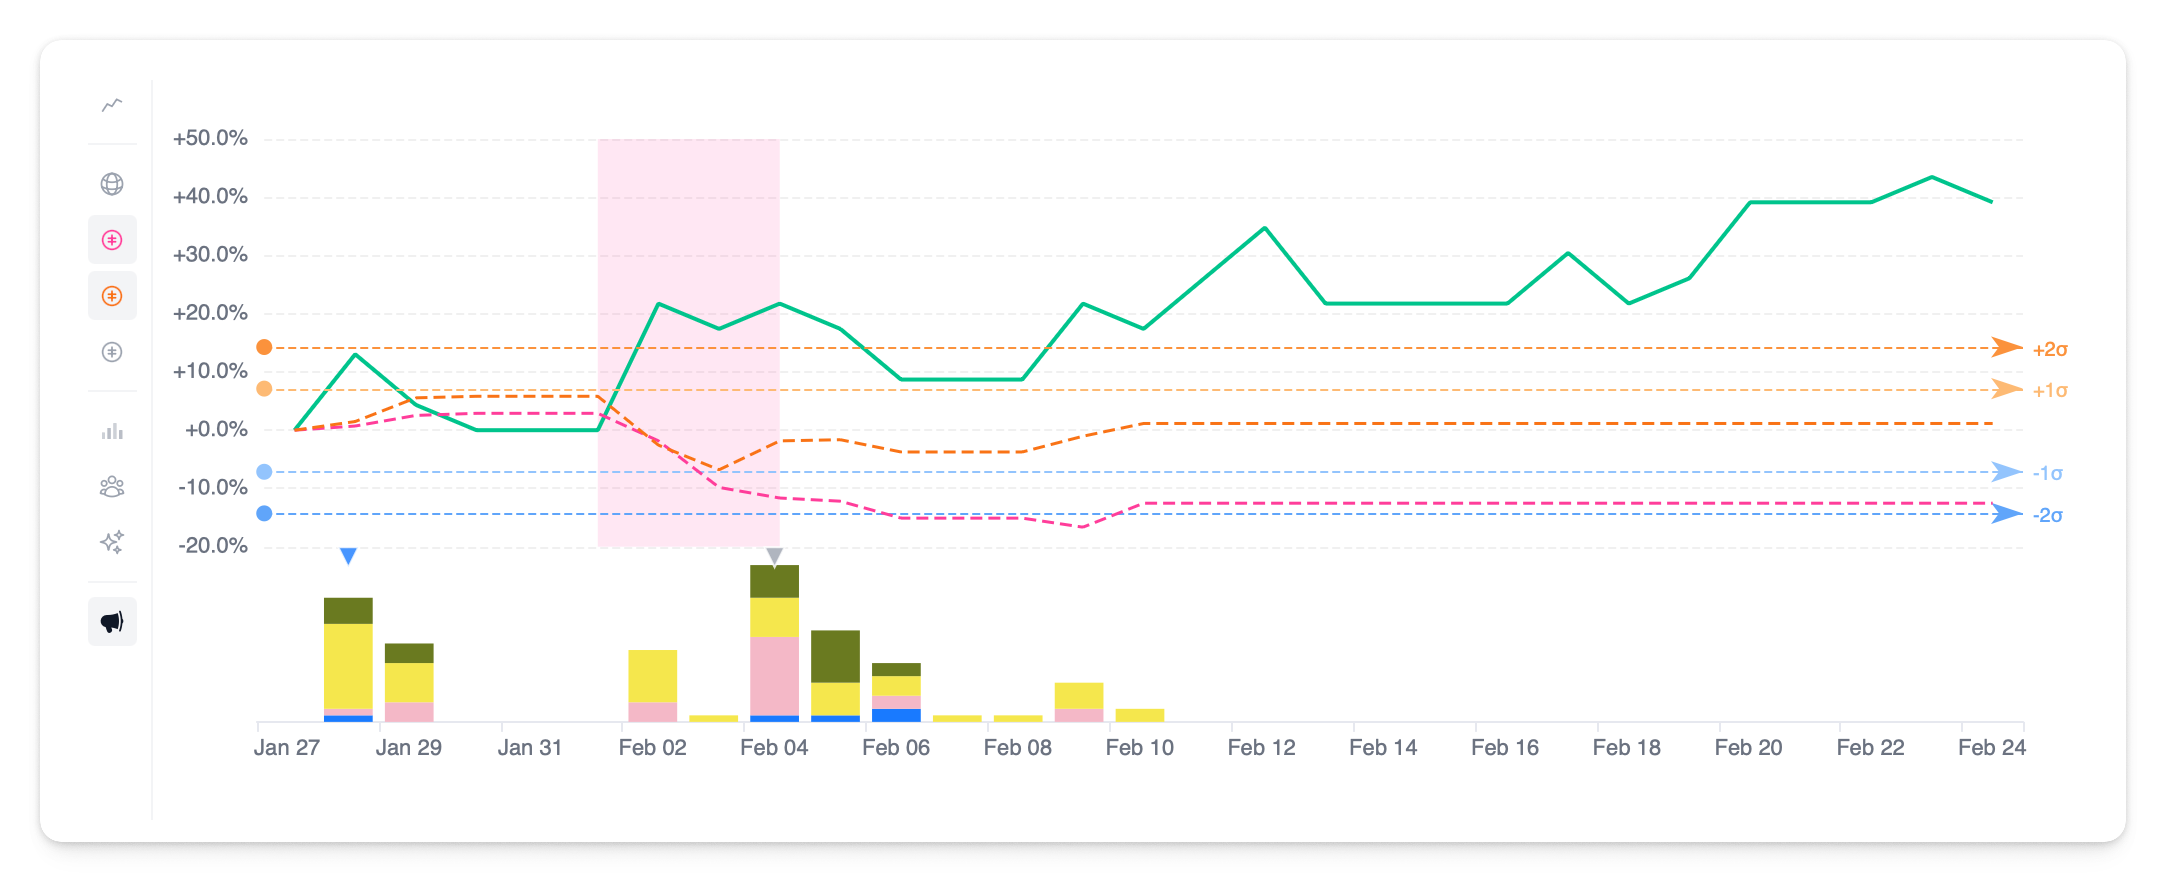
Short-term correlation can diverge significantly from long-term patterns during company-specific events.
Correlation vs. AR
| Metric | Question It Answers |
|---|---|
| AR | Did today's performance differ from what the market model predicted? |
| Correlation | How closely does our stock follow the benchmark over time? |
Use AR for event analysis (what happened today) — covered in Abnormal Returns. Use correlation for market positioning (how does the market categorise us in general).
Where r and β Appear on the Dashboard
You'll see r and β surfaced together beside each commodity and reference index in the right-hand market card on the Dashboard. The format is r = 0.07 · β = 0.05 — a single inline pair so both numbers are always read in the same context. Hover the values for an explanation.
When your stock moves against its usual correlation with the benchmark, that's a signal to investigate. Either company-specific news is driving the price, or there's unusual activity worth understanding.