Announcements
See how the market reacts to your ASX announcements — from same-day price impact to sustained sentiment over the following days.
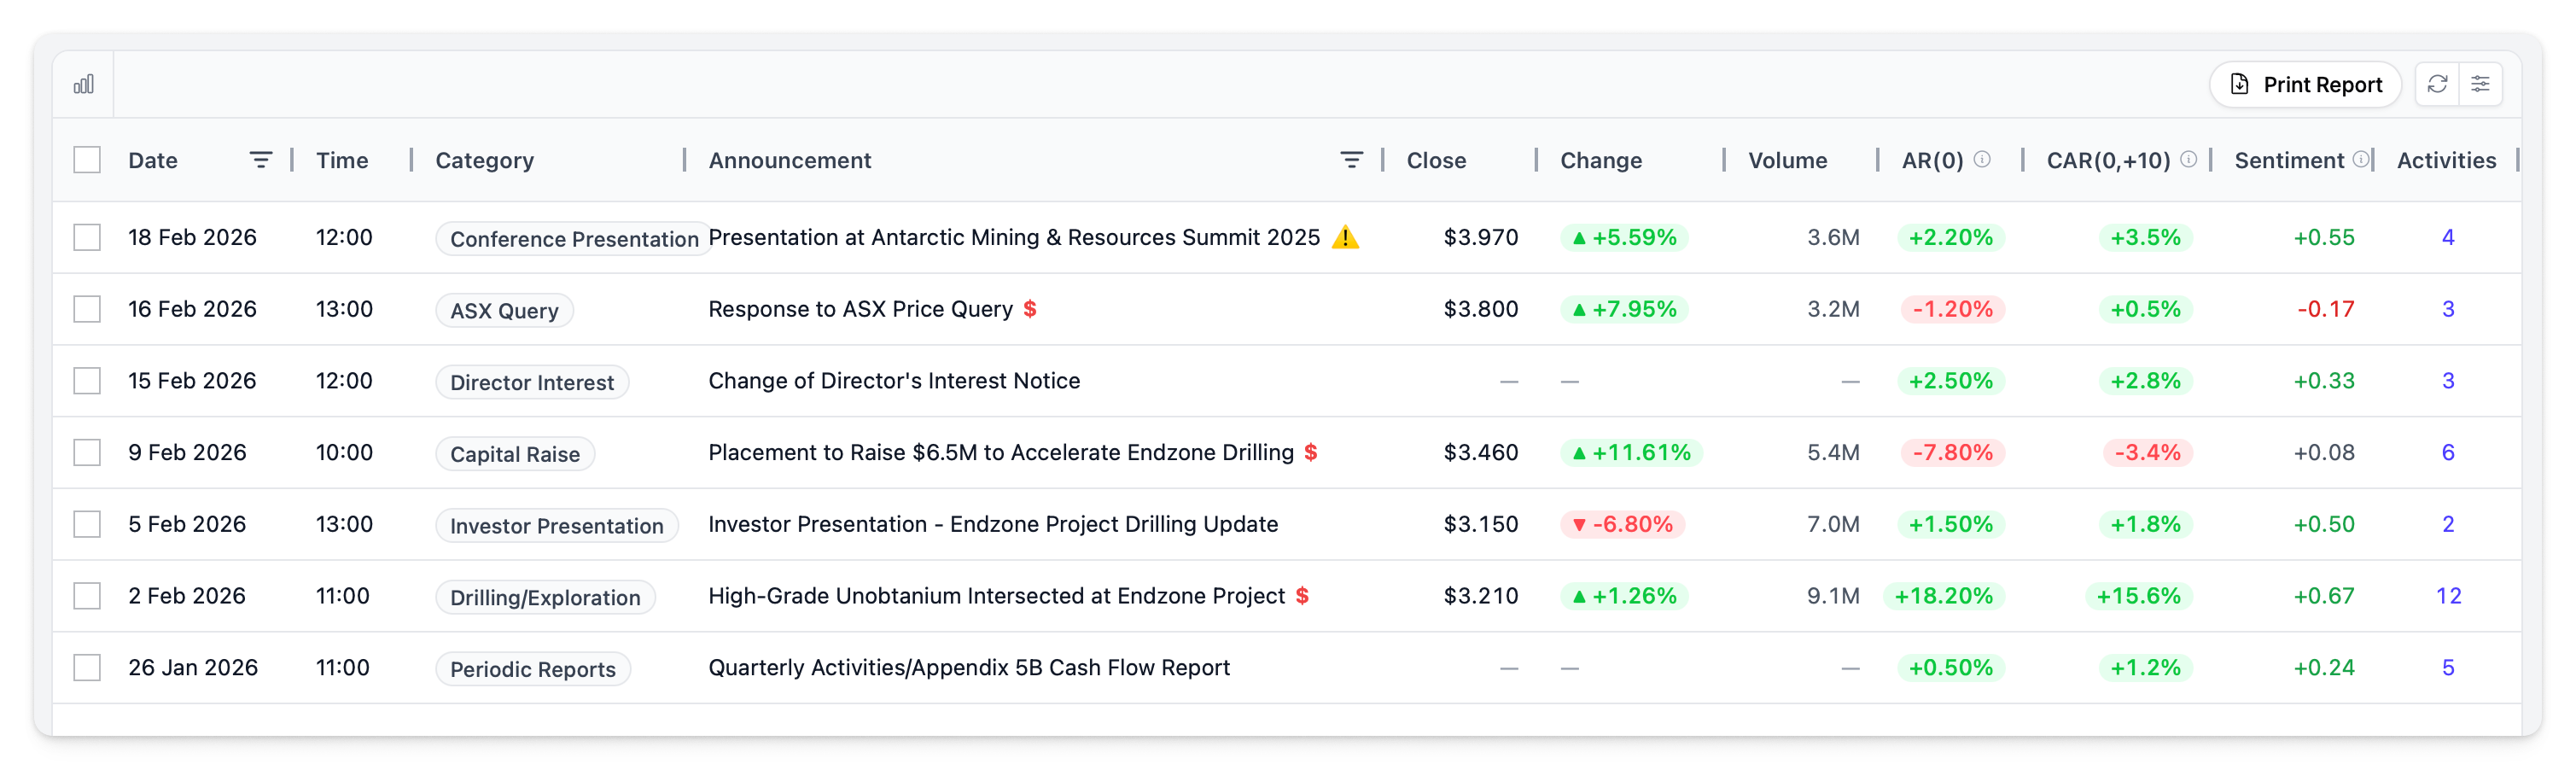
Announcements Grid
Announcements display in a data grid with powerful filtering and sorting.
Columns
| Column | Description |
|---|---|
| Date / Time | Announcement date and time (AEST) |
| Category | Automatically detected category based on headline content — e.g., Drilling, Capital Raise, Quarterly Report. See Announcement Categorisation |
| Title | Announcement headline. $ badge indicates price-sensitive. ⚠️ icon flags possible pre-announcement information leakage (see Leak Detection) |
| Close | Closing share price on announcement day |
| Change | Percentage change from previous close |
| Volume | Shares traded on announcement day, with comparison to 20-day average volume (e.g., "2.3x" indicates 2.3 times average volume) |
| AR(0) | Abnormal Return on announcement day — how much the stock moved beyond what was expected given market conditions. See Abnormal Returns |
| CAR(0,+10) | Cumulative Abnormal Return over 10 trading days after announcement. Shows whether the market reaction sustained or faded. See CAR |
| Sentiment | Average sentiment across linked activities, scored from -1 to +1. See Sentiment Scoring |
| Linked | Number of activities linked to this announcement |
Toolbar
| Button | Action |
|---|---|
| Chart toggle | Show or hide the share price chart |
| Filters | Open the sidebar filter panel |
| Reset Layout | Restore default column layout |
| Print Report | Generate a report from selected announcements |
Price-Sensitive Announcements
Announcements marked with $ are flagged by the ASX as material information likely to affect the share price — earnings results, capital raises, major contracts, and other market-moving disclosures.
Default filter: Price-sensitive announcements only. Toggle to show all announcements.
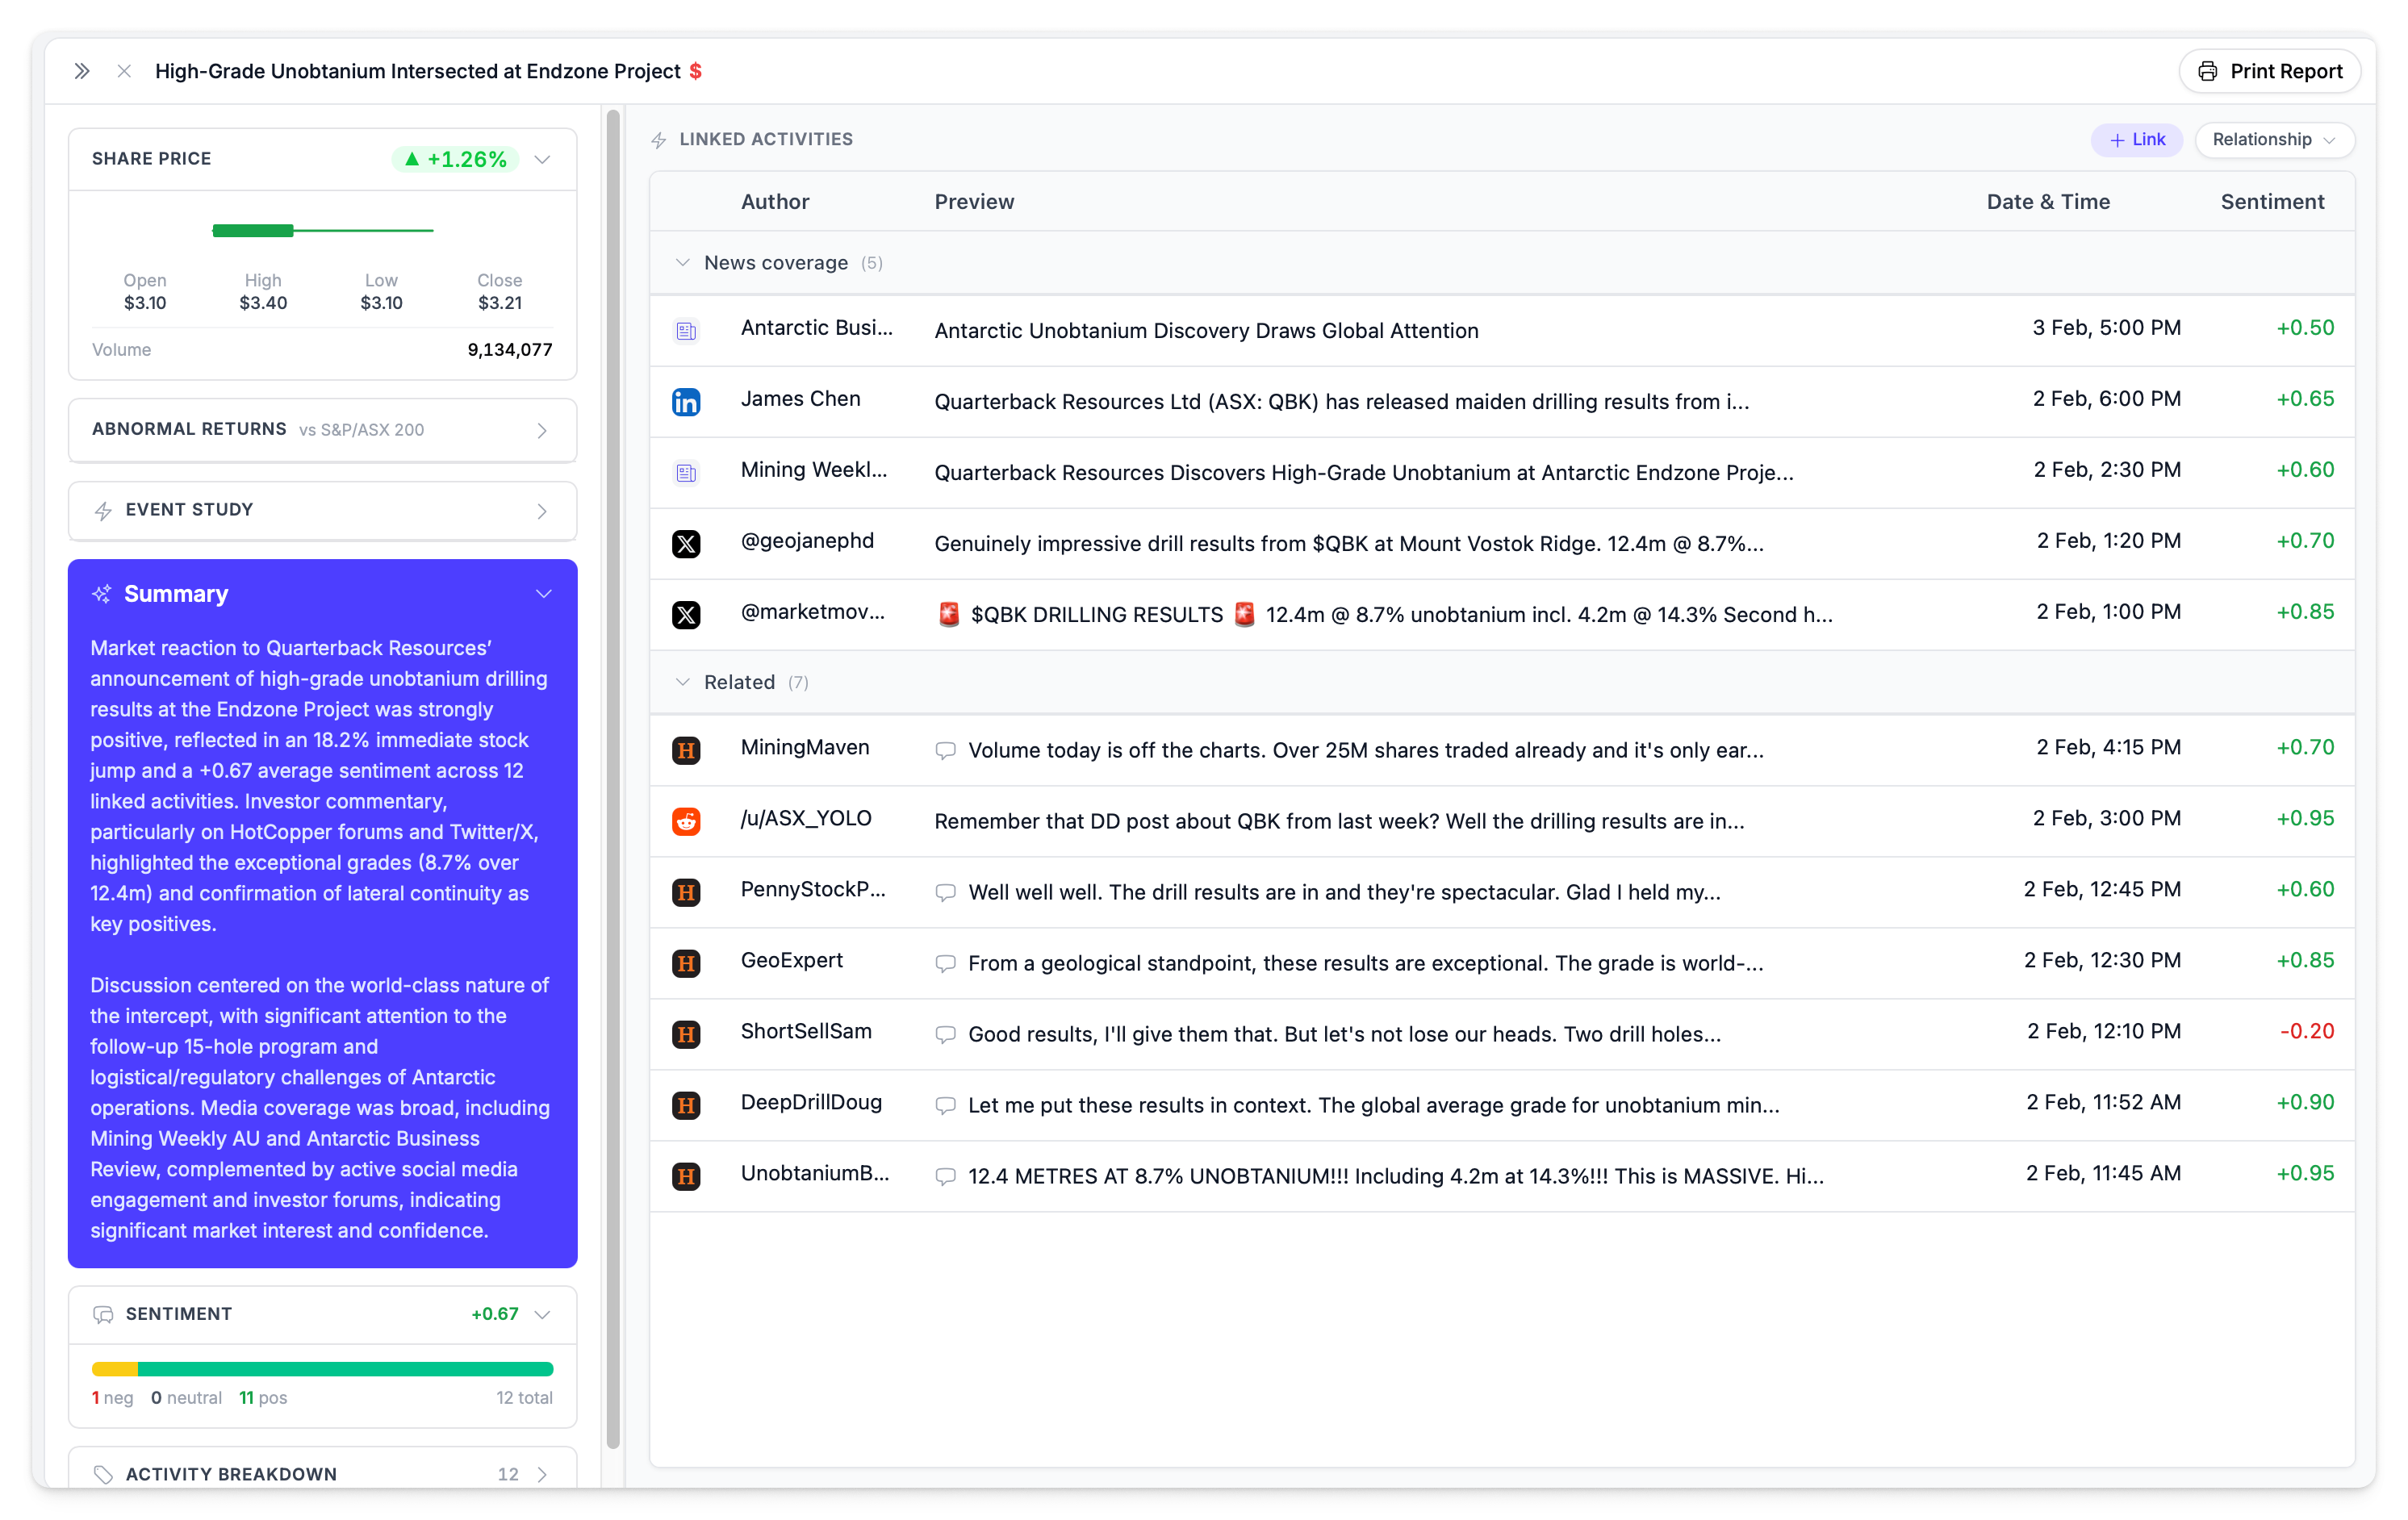
Announcement Details
Click any announcement to open the detail panel. The panel contains collapsible sections:
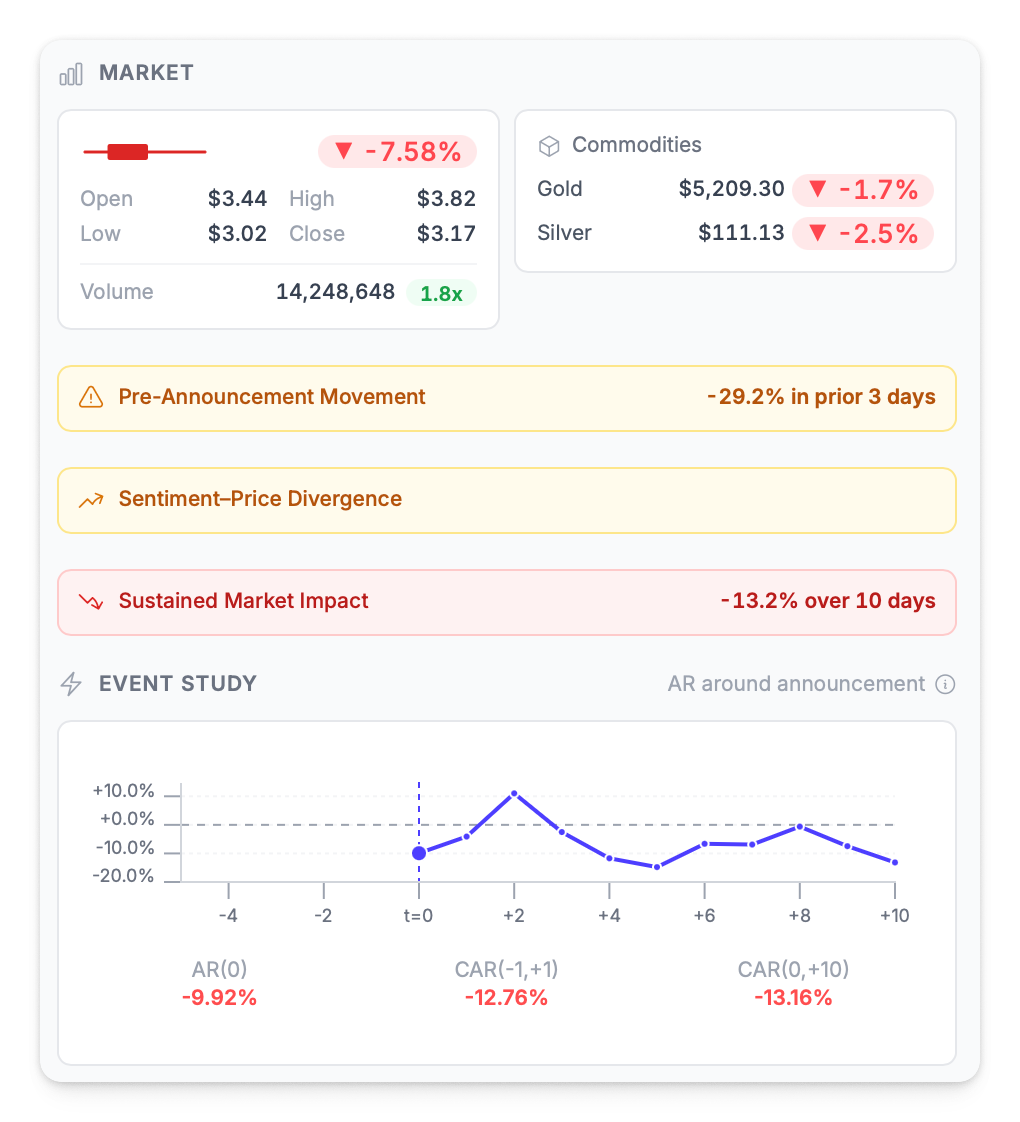
Share Price
- Mini candlestick chart showing OHLC for the day
- Daily return with trending indicator
- Volume comparison vs 20-day average (shown as a ratio like "2.3x")
Abnormal Returns
Multiple CAR windows showing different aspects of market reaction:
| Window | What It Measures |
|---|---|
| AR(0) | Abnormal return on announcement day |
| CAR(-5,-1) | Extended pre-announcement window — used for leak detection |
| CAR(-3,-1) | Pre-announcement window |
| CAR(-1,+1) | 3-day reaction window |
| CAR(0,+10) | 10-day impact window — did the reaction sustain or fade? |
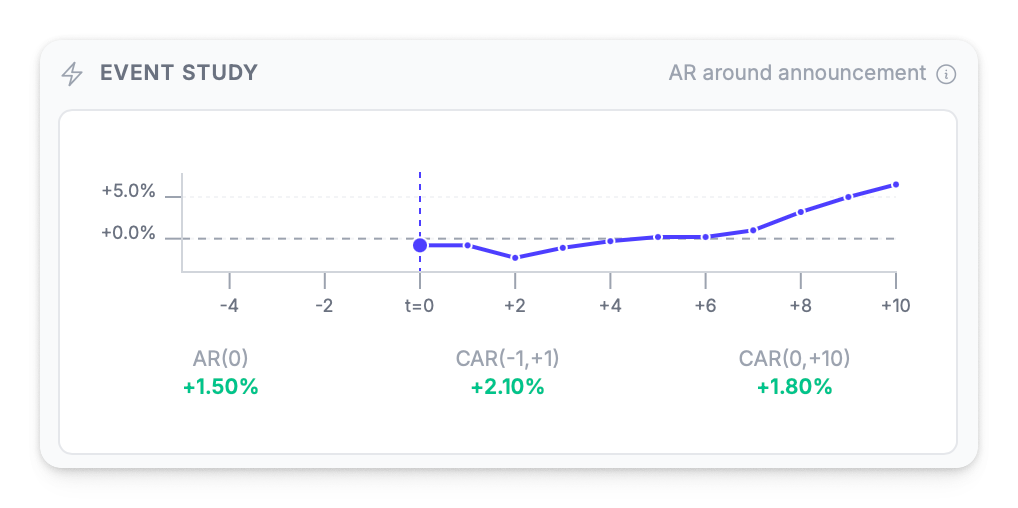
Event Study Chart
CAR chart showing 10 days before and after the announcement, visualising how abnormal returns accumulated over the event window.
AI Summary
AI-generated analysis of the announcement's market impact, including trading context, sentiment summary, and key themes from linked activities.
Linked Activity Breakdown
Activities linked to the announcement are grouped by category:
| Category | What It Includes |
|---|---|
| Broadcasts | Official company communications (format = broadcast) |
| Media | News articles and media coverage |
| Chatter | Social media posts, forum discussions, and community activity |
Activities can also be viewed grouped by Relationship (Related, Broadcast, Coverage, Promotion) or by Source (platform).
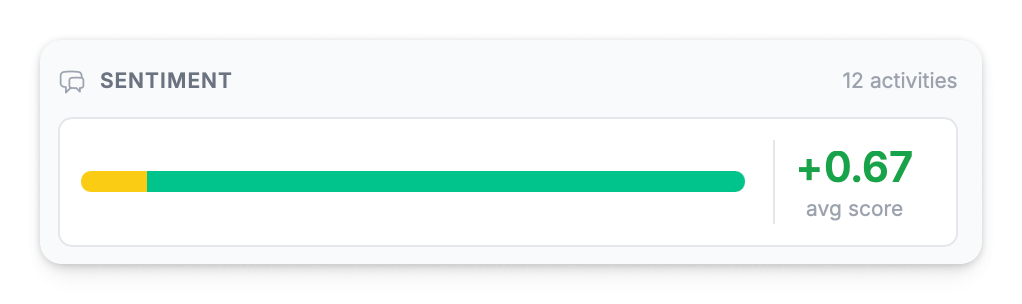
Sentiment Analysis
Visual sentiment distribution showing positive, neutral, and negative breakdown with average score across all linked activities.
High Engagement & Compliance Badges
- Activities with above-average engagement are marked with a high engagement badge
- Activities flagged as potential rumours (40%+ confidence) show a compliance alert badge
Leak Detection
The ⚠️ icon appears on announcements where pre-announcement trading patterns suggest possible information leakage. The platform analyses:
- CAR(-3,-1) — abnormal returns in the 3 days before announcement
- CAR(-5,-1) — abnormal returns in the 5 days before announcement
- Pre-window cleanliness — whether returns were unusually directional before the announcement
When detected, the leak signal can be filtered from the grid or via the Dashboard sidebar alert.
Compare CAR across announcements of the same category to understand which types drive sustained impact versus temporary spikes.
Expanded Announcement View
Click the expand icon on any announcement to open the full expanded view, showing all detail sections in a wider layout.
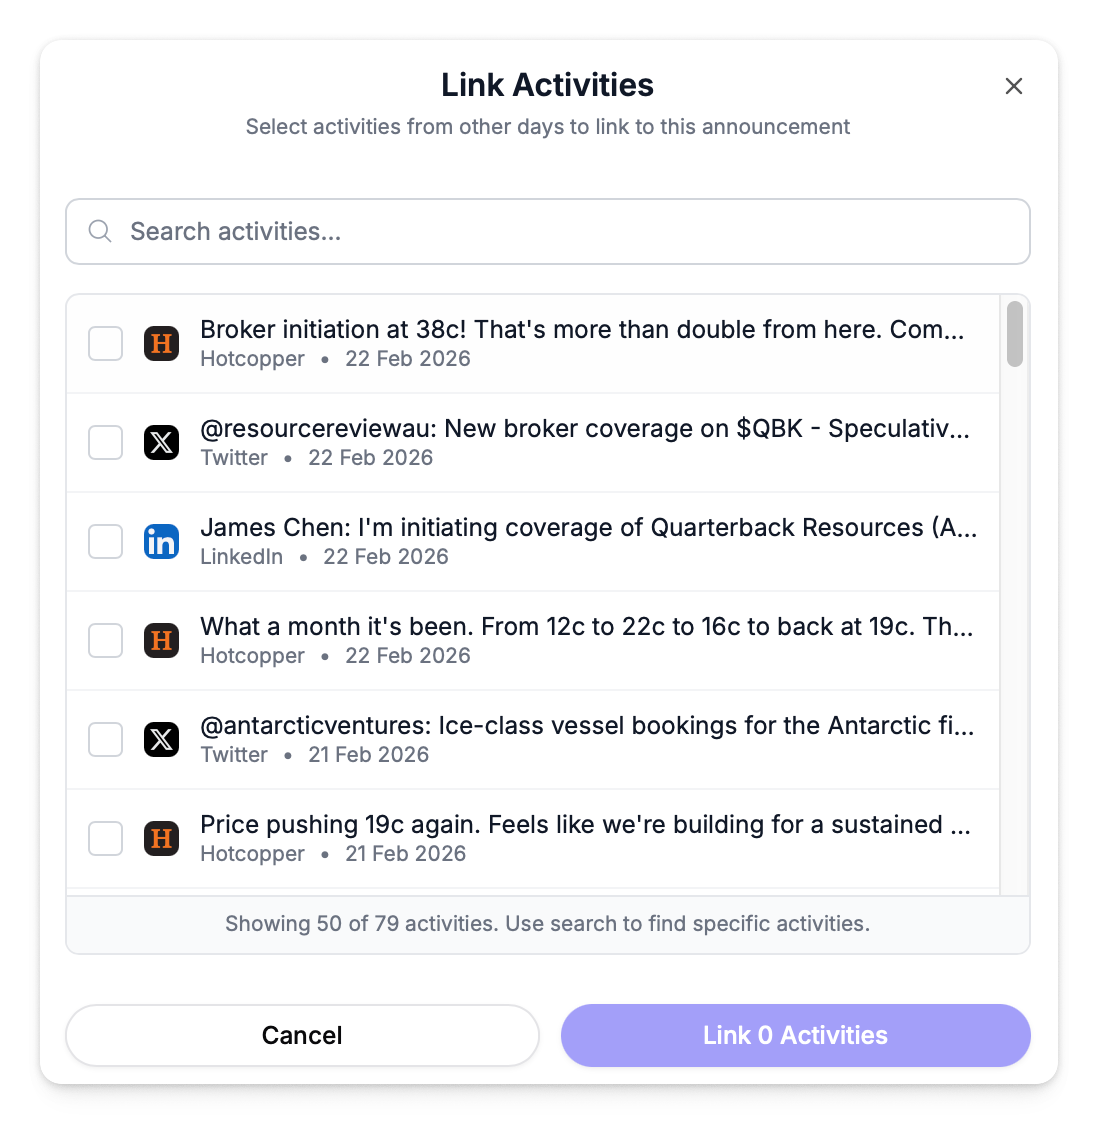
Linking Activities
Connect activities to announcements to build the full picture of market reaction.
- Open the announcement detail panel
- Click Link Activities
- Search and select activities from other days
- Linked activities appear in the breakdown and contribute to the announcement's sentiment average
Generating Reports
Select announcements using the checkboxes in the grid, then click Print Report in the toolbar to generate an announcement report with market metrics, activity breakdown, sentiment analysis, and linked activity details.
See Announcement Reports for full details on the report contents and options.
You can also export the grid data as CSV for offline analysis.