Reports
Turn your data into board-ready documents — comprehensive reports that combine market metrics, sentiment analysis, and activity breakdowns in a format stakeholders can act on.
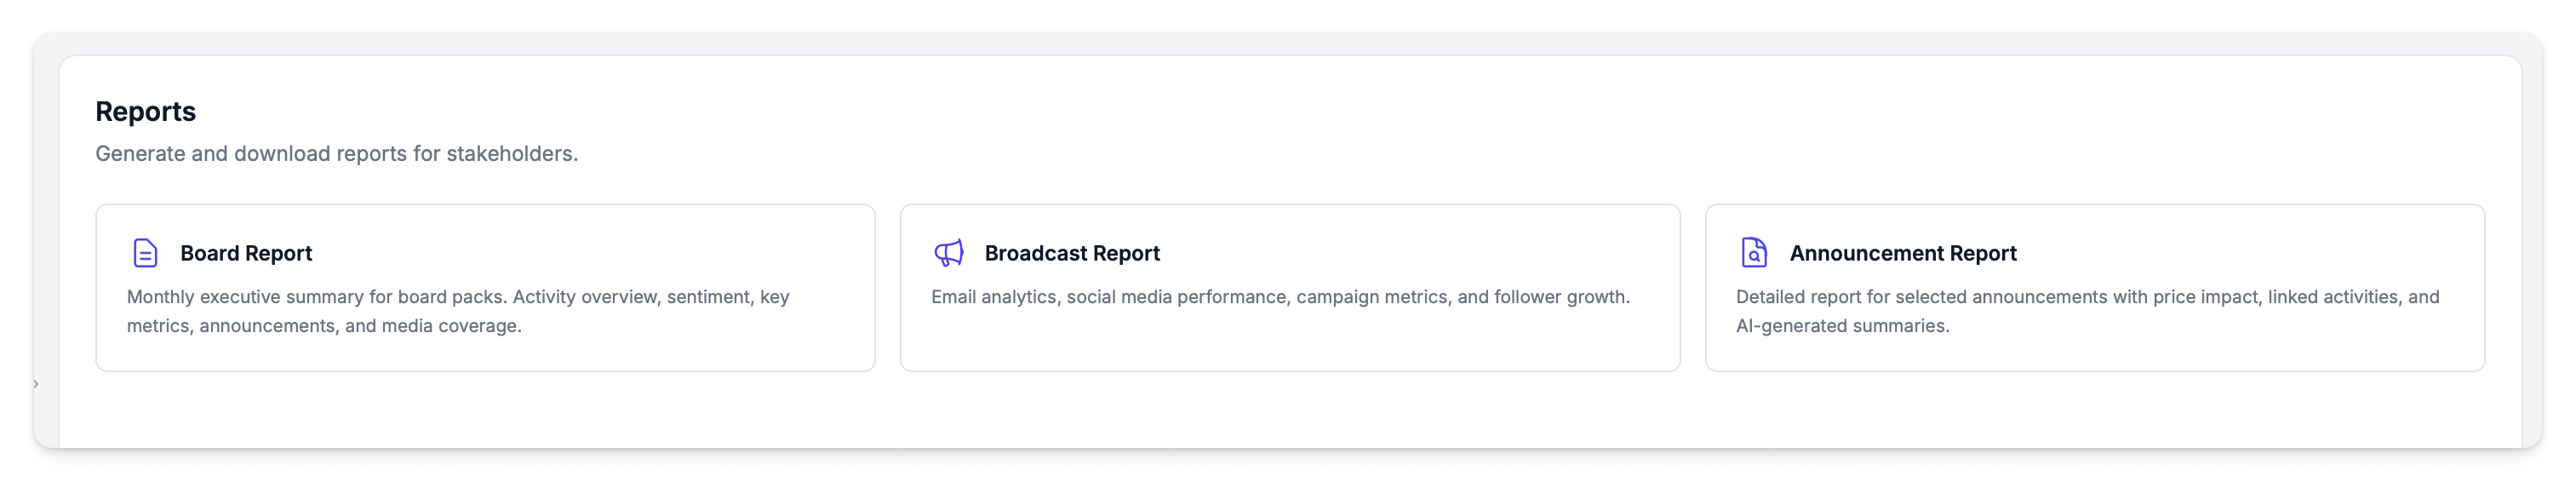
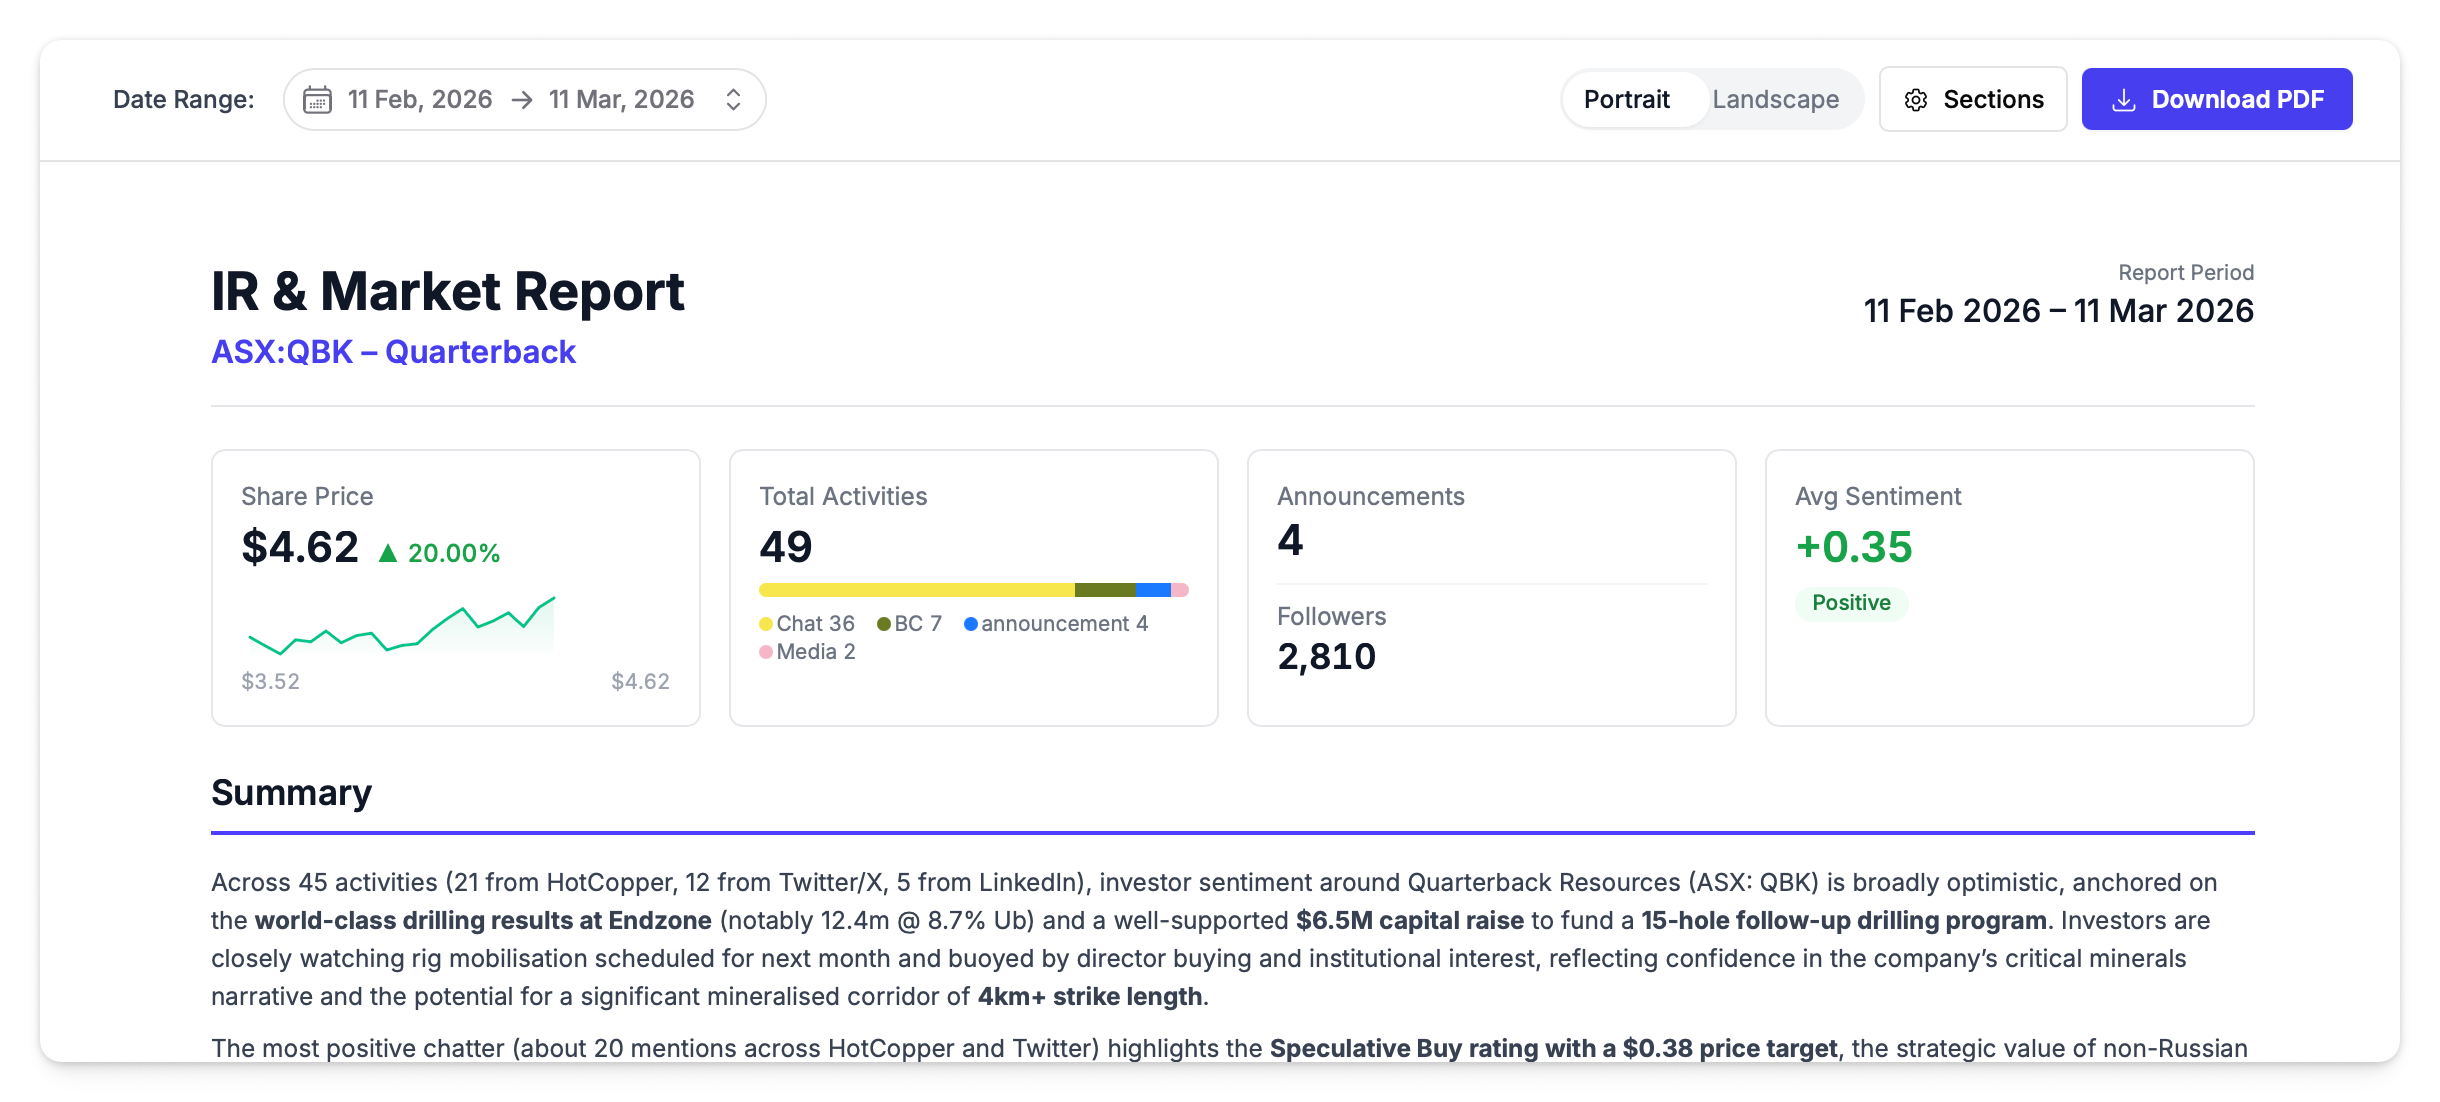
Board Report
A comprehensive multi-section report designed for board packs and stakeholder updates.
Sections
The board report includes up to 9 sections:
| Section | What It Contains |
|---|---|
| Summary | AI-generated executive summary, key metrics, and editable notes |
| Activities & Share Price | Quick stats and share price vs activity chart for the period |
| Announcement Performance | Price-sensitive announcements, impact timeline, and CAR by category |
| Sentiment | Sentiment by source and sentiment vs share price chart |
| Media Coverage | Article count, media timeline, and source concentration |
| People | Author influence analysis, scatter chart, and flagged people |
| Broadcasts | Events vs price, campaign performance, and email analytics (if Mailchimp connected) |
| Flagged Activities | Activities flagged by your team for follow-up or attention |
| Market Intelligence | Z-score analysis, spike timeline, returns scatter, and drawdown charts |
Generating a Board Report
- Navigate to Reports → Board Report
- Set the date range using the date picker
- Click Generate Report — this takes a moment as the system pulls activities, market data, and generates AI insights
- Review and edit the Notes section if needed
- Click Download PDF to save
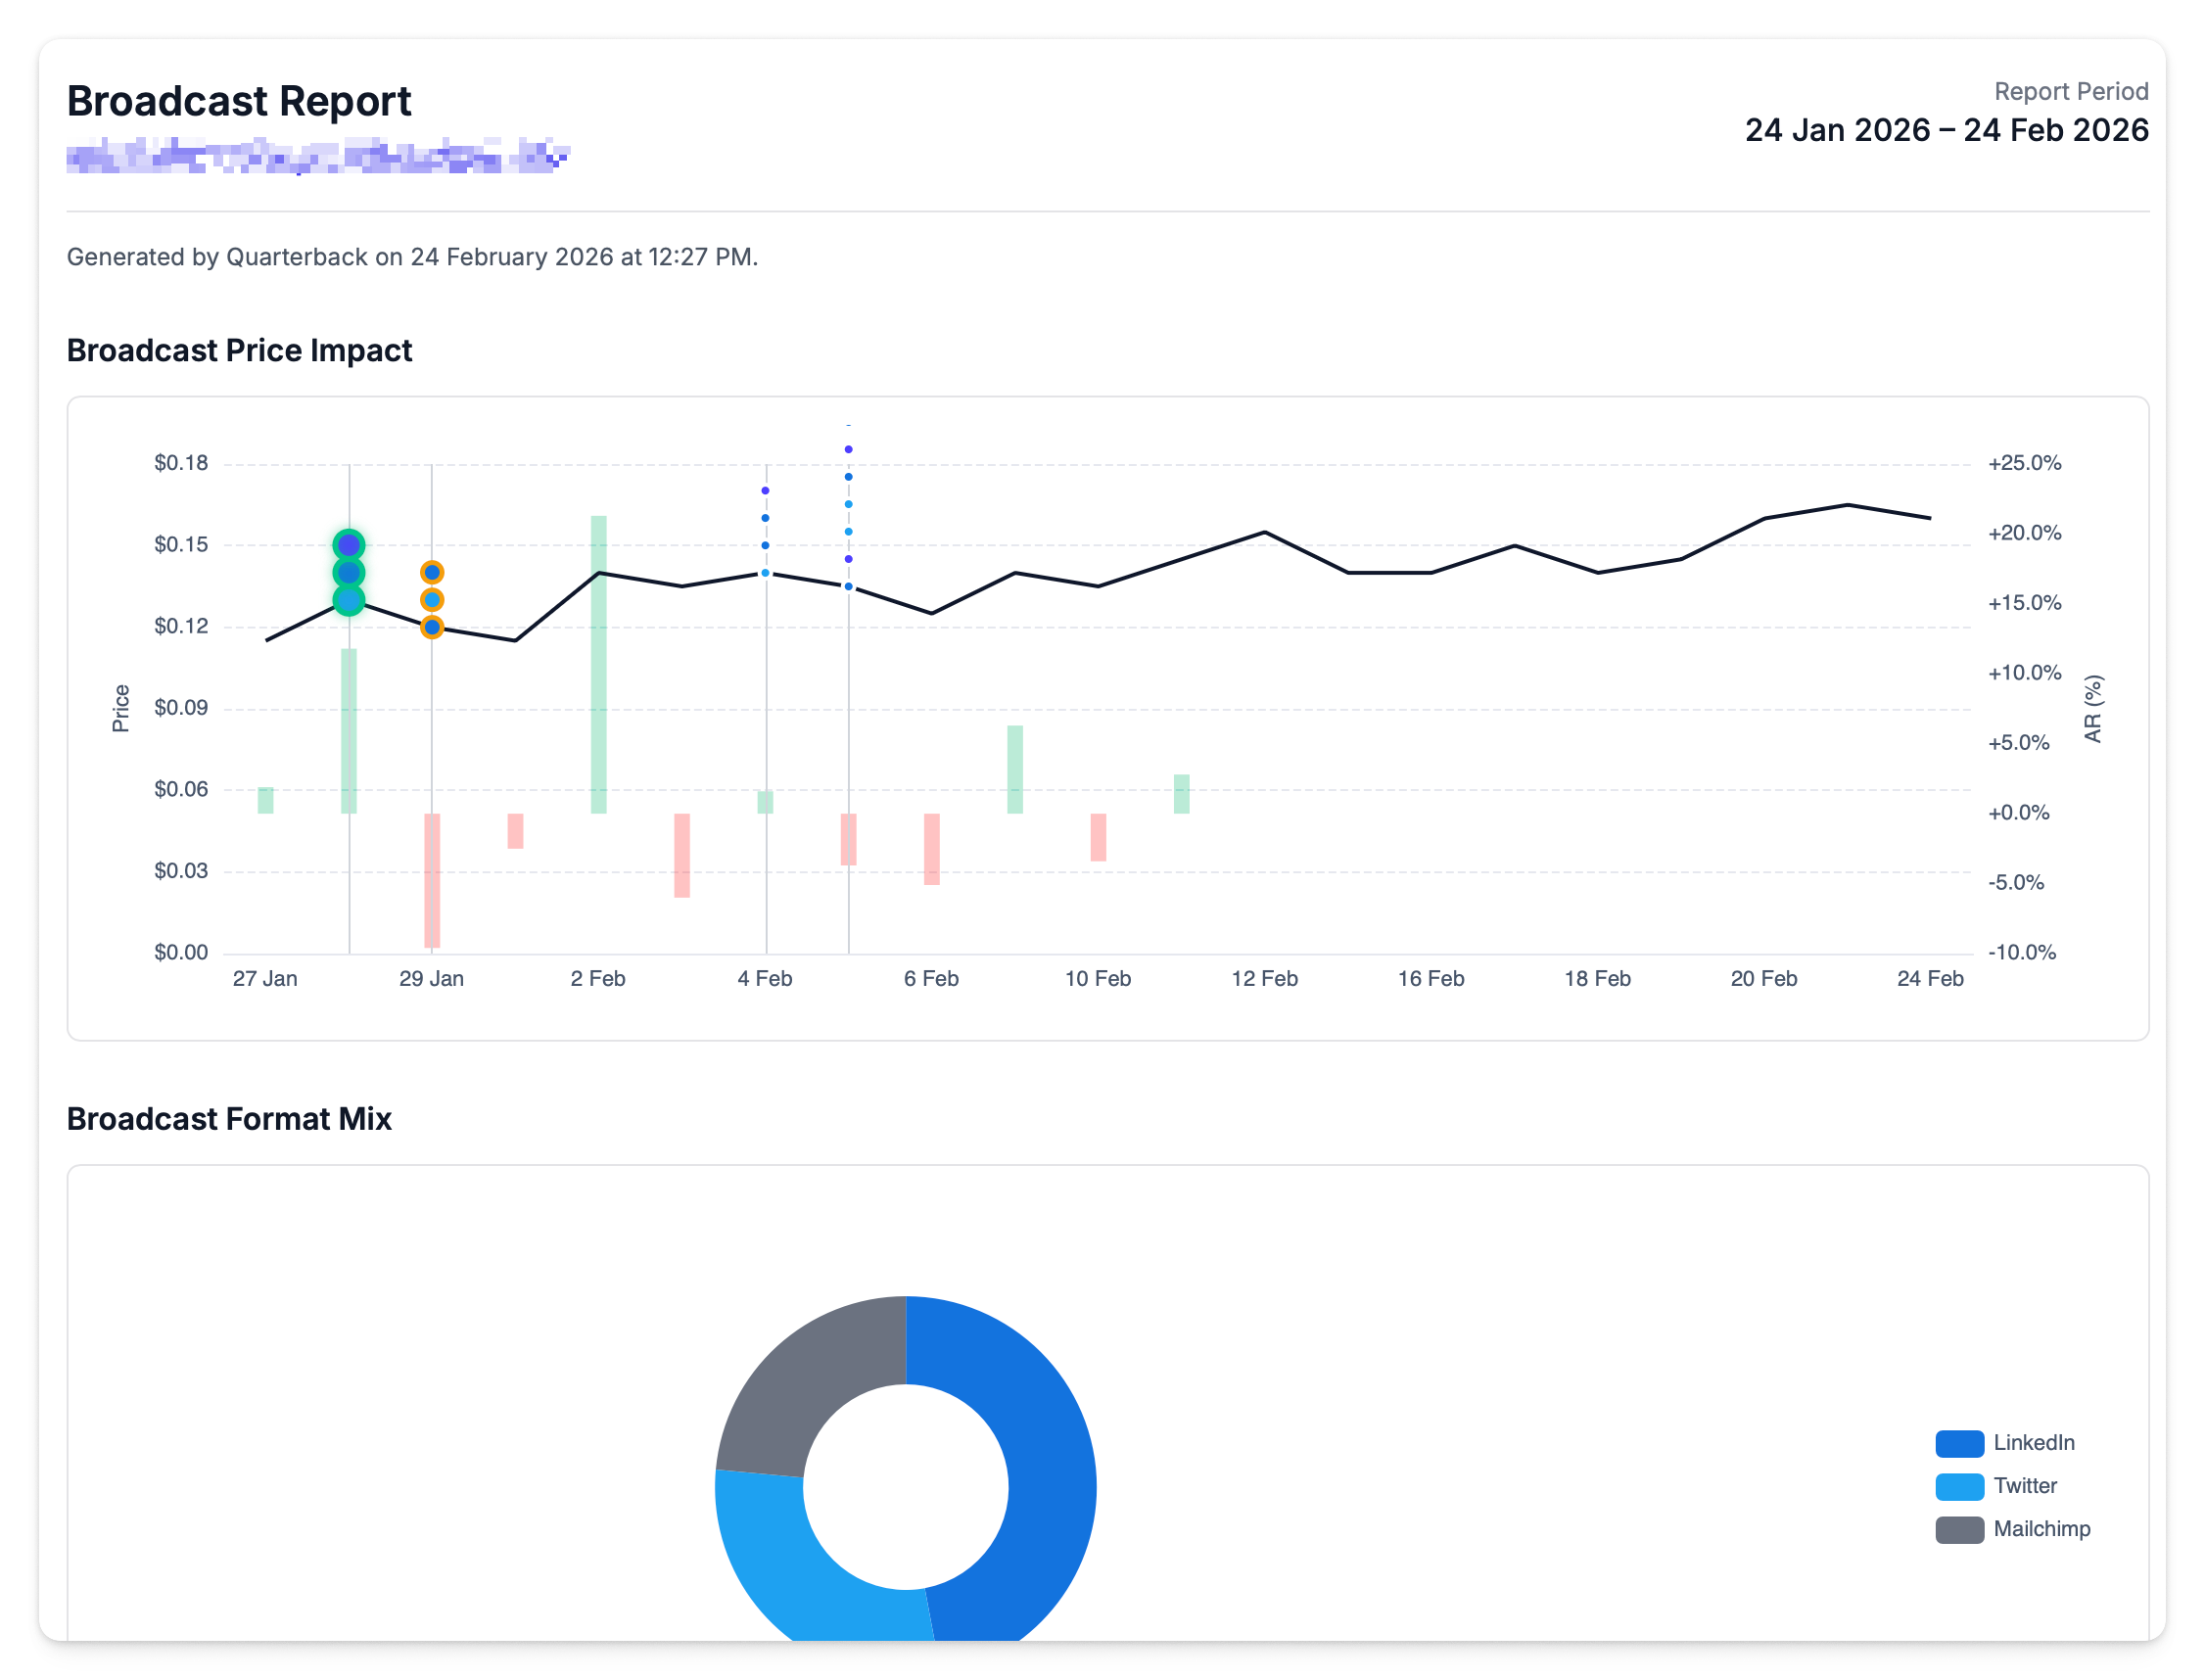
Broadcast Report
Track the performance of your communications across email and social media.
| Section | What It Shows |
|---|---|
| Campaign Performance | Mailchimp campaign metrics — sends, opens, clicks |
| Subscriber Metrics | Subscriber counts across connected platforms |
| Email Analytics | Detailed table of individual campaign performance |
| Follower Growth | Trends for Twitter, LinkedIn, Mailchimp, YouTube, and Facebook followers over time |
The Broadcast Report requires a connected Mailchimp integration for email campaign data. Follower metrics come from your connected social accounts.
Announcement Reports
Generate detailed reports for individual or multiple announcements with market impact charts, AI analysis, sentiment breakdowns, and linked activity details. Select announcements from the Announcements grid, click Generate Report, and the report opens in a new tab.
See Announcement Reports for full details.