People
Understand who's driving the conversation about your company — from frequent forum posters to high-reach media voices.
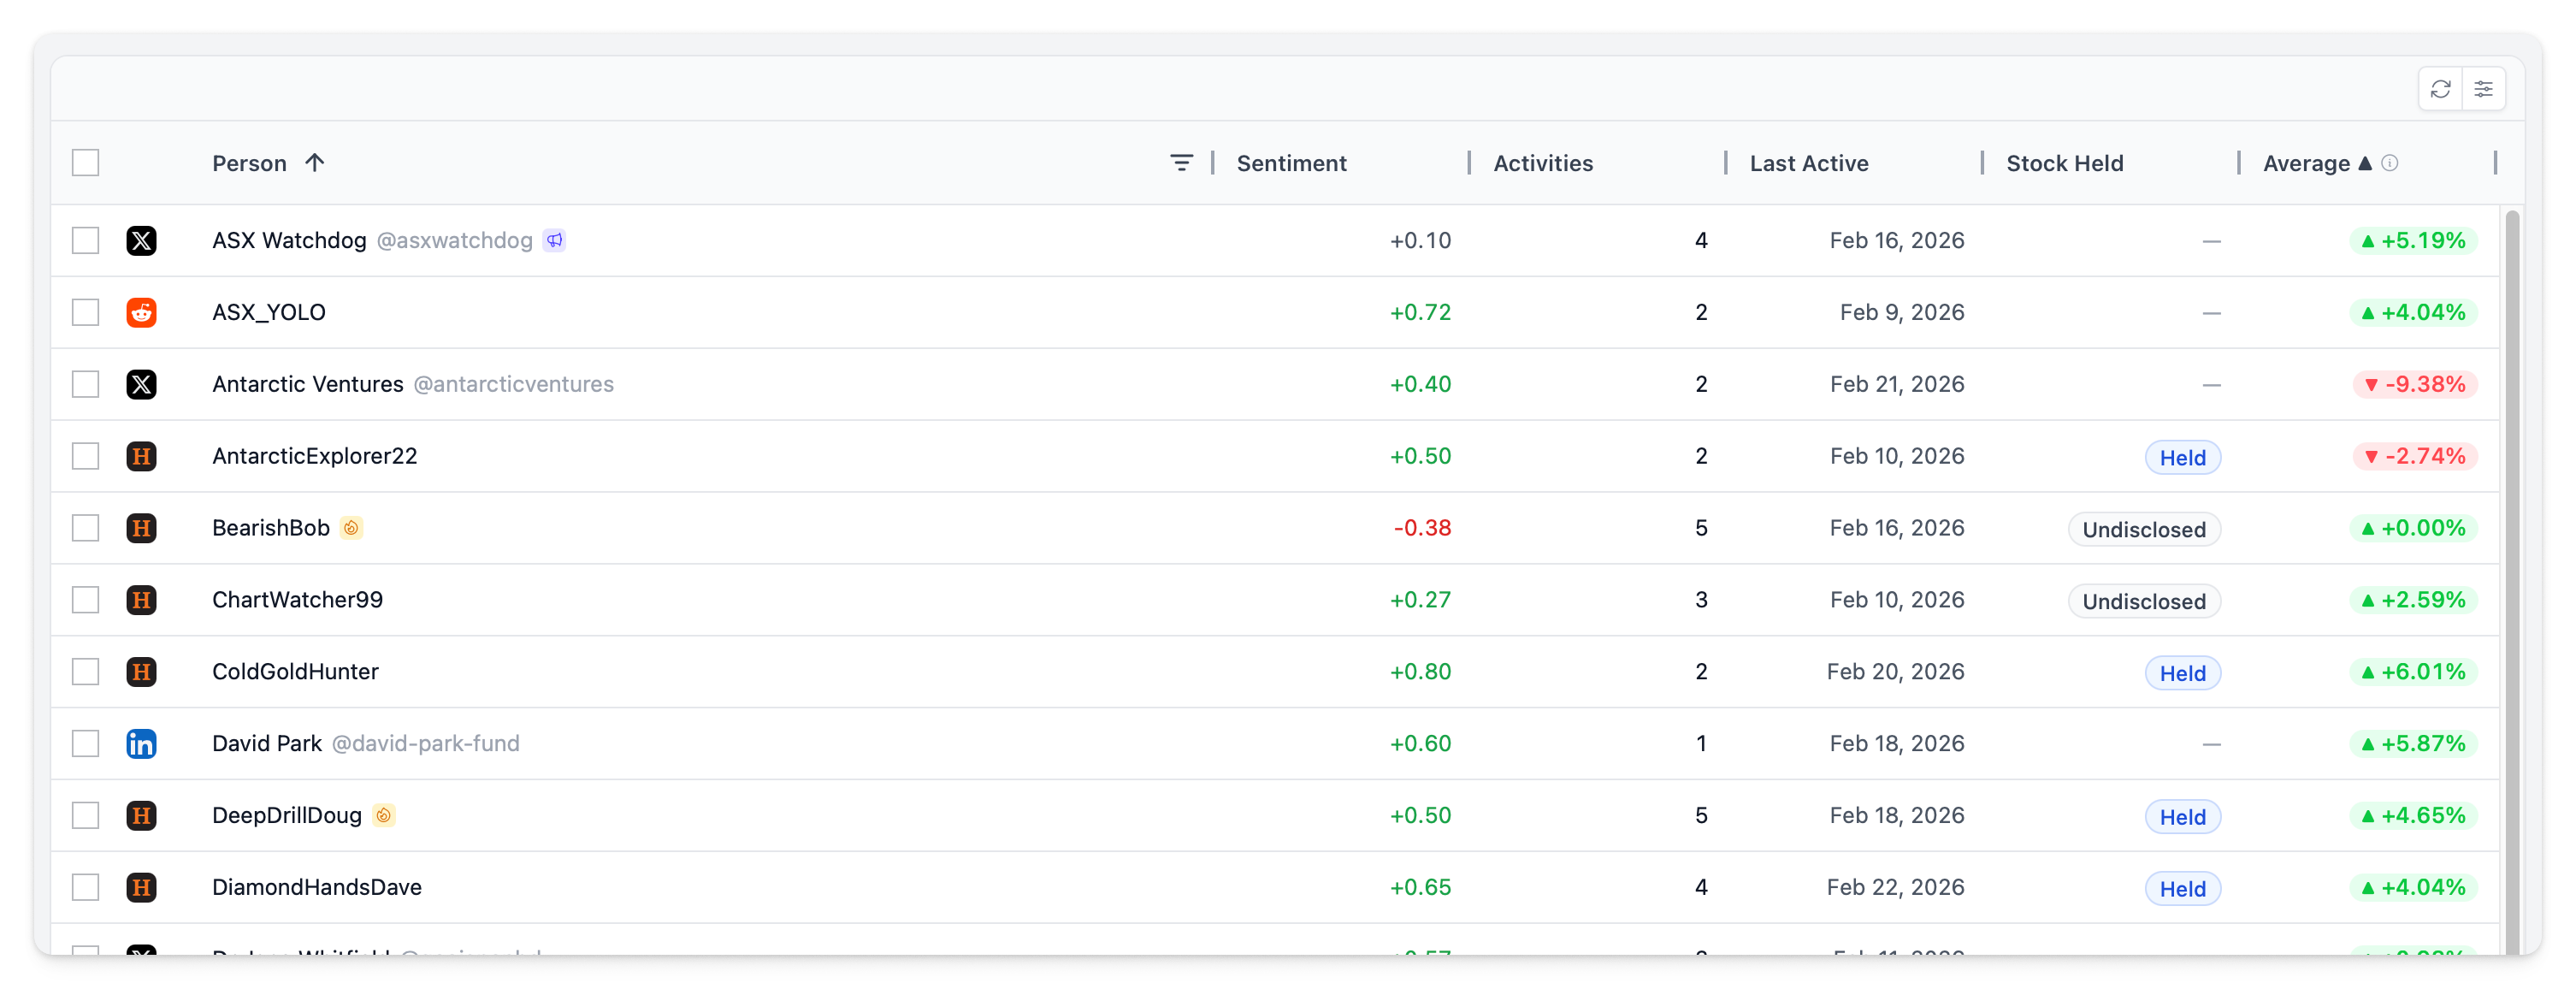
People Grid
The people page shows all authors across every monitored platform, with aggregated statistics for each.
| Column | Description |
|---|---|
| Source | Platform the author is active on |
| Author | Name with badges (see below) |
| Sentiment | Average sentiment across all their posts |
| Activities | Total activity count |
| Last Active | Most recent activity date |
| Stock Held | Whether the author holds stock (forum disclosure) |
| Average ▲ | Average share price change on days when this author posted |
Toolbar
| Button | Action |
|---|---|
| Export All | Export all people data to CSV |
| Export Selected | Export only selected people to CSV |
| Reset Layout | Restore default column layout |
Filtering
The sidebar panel provides filters to narrow your view:
| Filter | Options |
|---|---|
| Source | Filter by platform (Twitter, LinkedIn, Reddit, etc.) |
| Frequency | Frequent authors vs Occasional |
| Reach | High Reach vs Standard |
| Flagged | Show only flagged people |
| Stock Disclosure | Disclosed vs None |
The sidebar also includes column visibility toggles and column reordering.
Author Badges
Badges surface authors who stand out from the crowd.
| Badge | Icon | Criteria |
|---|---|---|
| Frequent Author | Fire | Posts significantly more than average (mean + 1.5 standard deviations, minimum 2 posts) |
| High Reach | Megaphone | Top 10% by follower count — outsized potential impact |
| Flagged | Flag | Manually flagged by your team for attention |
Author Details
Click any author to open their detail panel.
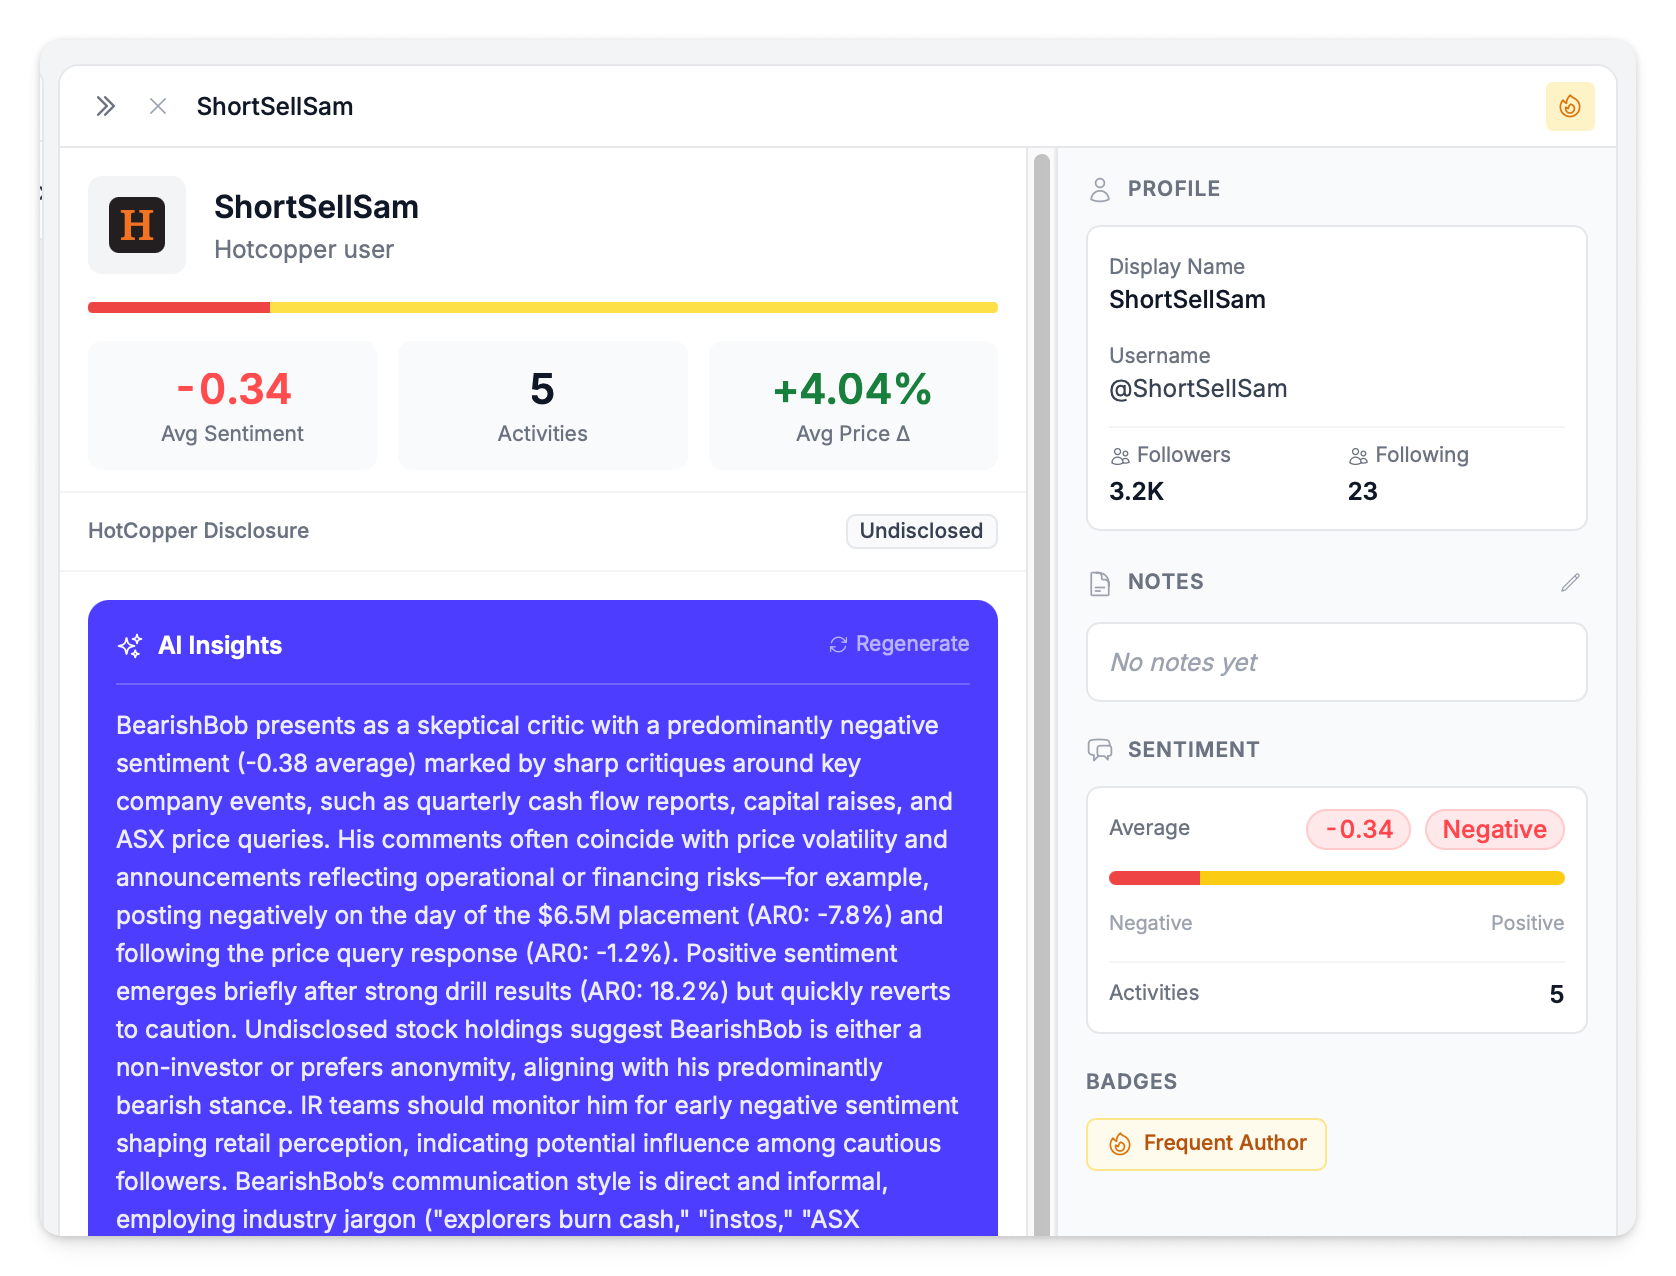
The detail panel shows:
- Profile information and follower count
- All activities from this author
- Sentiment distribution across their posts
- Notes — organisation-specific notes your team can add
- Edit form for updating author information
AI Insights
The author detail panel includes an AI-generated insights section that analyses the person's posting history in the context of your company events. The AI generates two key assessments:
- Activity & sentiment analysis — characterises the author (supporter, critic, neutral observer), identifies sentiment patterns over time, and flags correlations with company events like announcements or price movements
- Demographic profile — assesses communication style, investor profile (day-trader, long-term holder, institutional), and experience level based on their posting patterns
AI insights require a minimum of 3 activities from the author to generate. You can regenerate insights at any time to get an updated analysis based on the latest data.
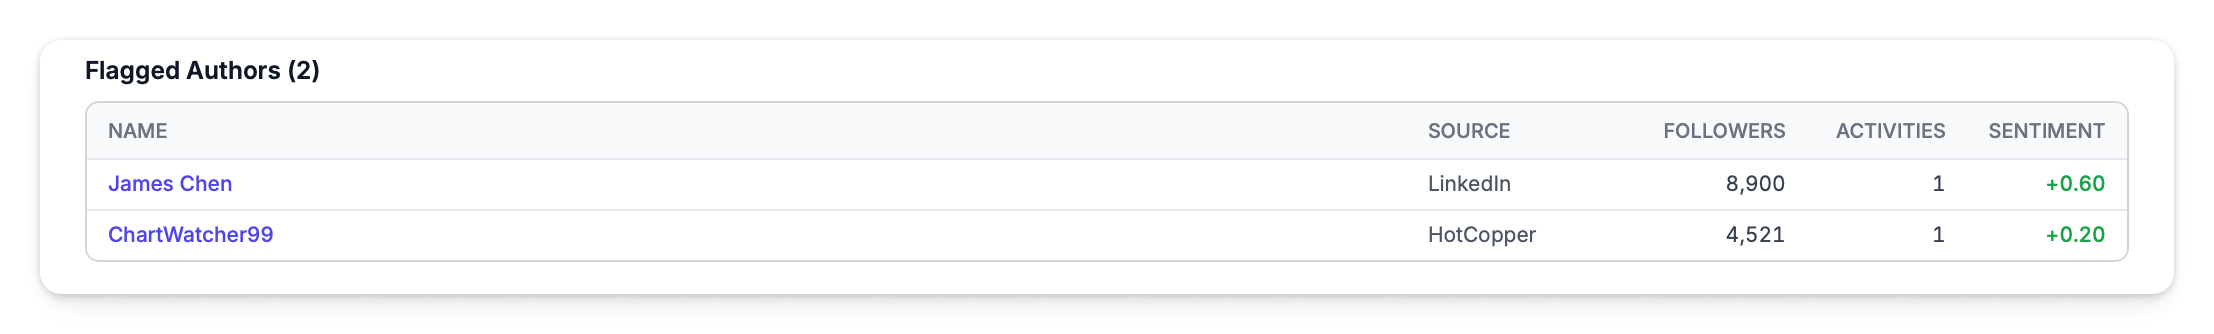
Flagging People
Flag authors to mark them for attention, track key individuals, or highlight people your team should monitor. Flagged people are indicated with a flag badge in the grid, can be filtered using the Flagged filter, and automatically appear in the People section of your Board Report.
How to Flag
- Open the author detail panel by clicking on a person
- Click the flag icon to toggle the flag on or off
- Flags are visible to all users on your company account
Filtering by Flagged
Add Flagged to your filters to show only flagged people. This is useful for:
- Monitoring key authors who regularly post about your company
- Building a watchlist of high-impact or high-risk individuals
- Reviewing who will appear in the People section of your next board report
Price Impact
The Average ▲ column shows the average share price change on days when the author posted. This helps identify authors whose activity correlates with price movements — whether causal or coincidental.
An author with high activity count, strong negative sentiment, and notable price impact on their posting days is someone worth monitoring closely.