Activities
Every conversation, article, and post about your company — tracked, scored, and connected to your share price.
What Is an Activity?
An activity is any tracked communication event related to your company. Activities are the fundamental data type in Quarterback — everything from tweets to ASX announcements to news articles flows in as an activity.
Think of an activity as a single unit of attention your company received. A forum post, a LinkedIn mention, a news article, an ASX announcement — each one is an activity, and Quarterback scores and tracks them all.
Activity Sources
Quarterback tracks 50+ sources across multiple categories:
| Category | Sources |
|---|---|
| Social Media | Twitter/X, LinkedIn, Facebook, Instagram, YouTube, TikTok |
| Forums | Reddit, Discord, Telegram, Slack |
| Official | ASX Announcements, Mailchimp campaigns, press releases |
| News | Publisher articles from thousands of outlets worldwide |
| Manual | Calls, meetings, presentations, events you add yourself |
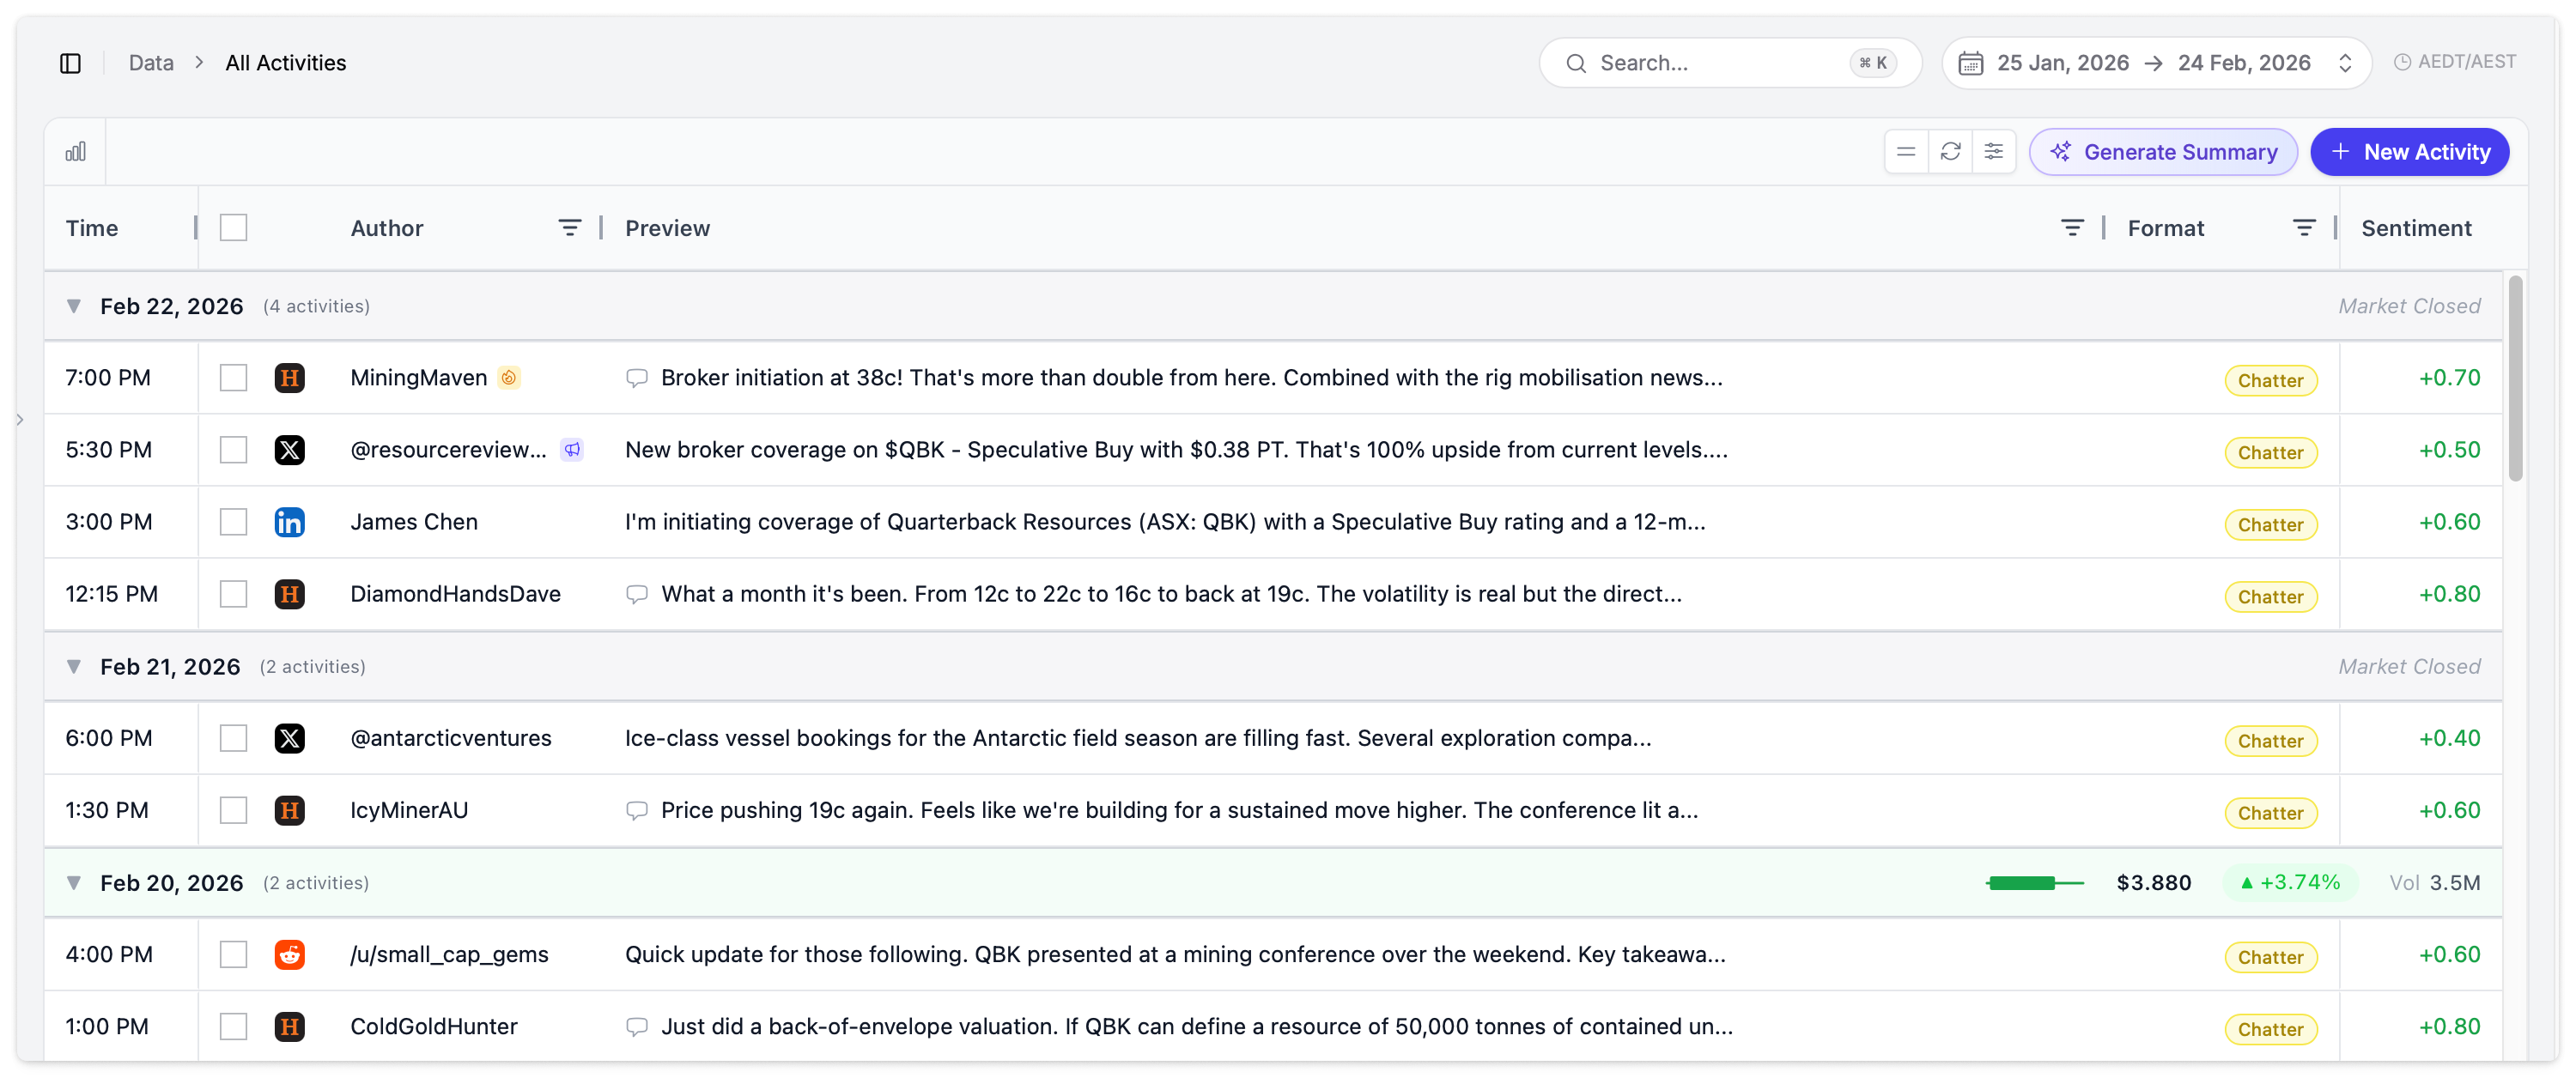
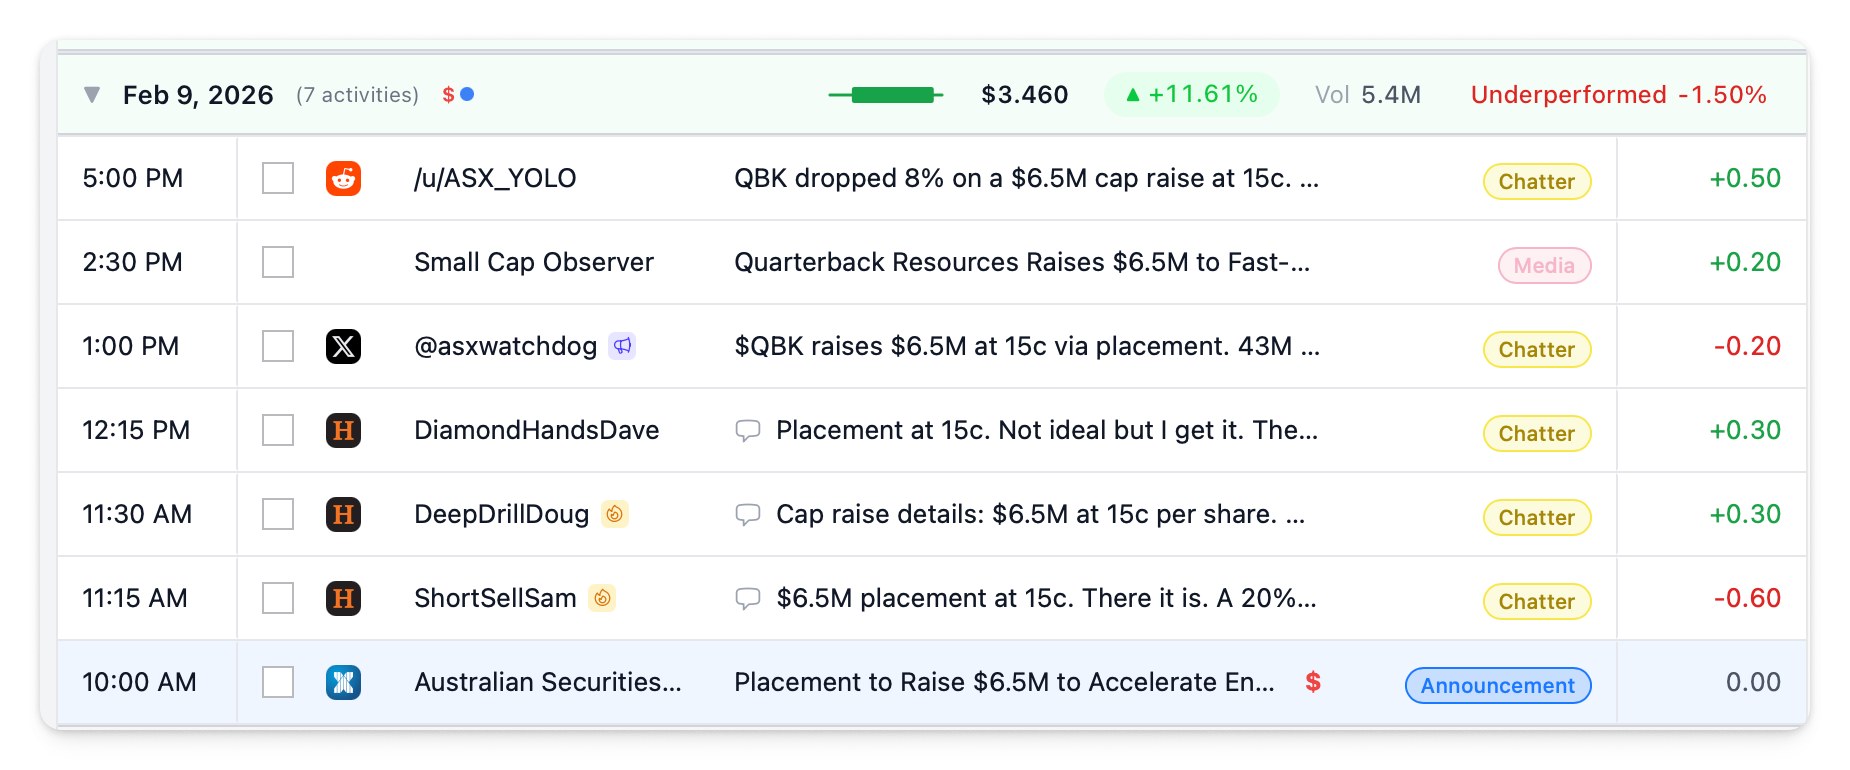
Activities Grid
Activities display in a data grid, grouped by date. Each date group header shows the share price and trading volume for that day, helping you correlate activity with market movements.
Toolbar
The toolbar at the top of the grid provides quick actions:
| Button | Action |
|---|---|
| Chart toggle | Show or hide the Share Price vs Activity chart above the grid |
| Generate Summary | Generate an AI summary of the currently visible activities |
| + New Activity | Add a manual activity |
| Expand / Collapse All | Expand or collapse all date groups in the grid |
| Reset Layout | Restore the default column layout and ordering |
| Export | Export activities to CSV |
Grid Columns
| Column | Description |
|---|---|
| Time | When it was posted |
| Author | Platform icon, author name, and badges (Frequent Author, High Reach) |
| Preview | Activity title and content snippet |
| Format | Badge showing Announcement, Chatter, Media, or Broadcast |
| Sentiment | Colour-coded sentiment score |
| Engagement | Likes, views, or other platform-specific engagement metrics |
| Thread | Thread indicator icon for activities that are part of a conversation |
| Price Sensitive | $ indicator for price-sensitive announcements |
| Market Activity | Badge showing Unusual or Very Unusual on abnormal trading days |
Group By
Activities can be grouped by different dimensions using the sidebar panel:
| Grouping | What It Shows |
|---|---|
| Date (default) | Activities grouped by day with share price and volume in the header |
| Source | Grouped by platform (Twitter, LinkedIn, Reddit, etc.) |
| Author | Grouped by who posted |
| Format | Grouped by Announcement, Chatter, Media, Broadcast |
| Linked Announcement | Grouped by which ASX announcement they relate to, with AR(0) displayed |
Filtering
The sidebar panel provides filters to narrow your view. Click the settings icon in the toolbar to open it.
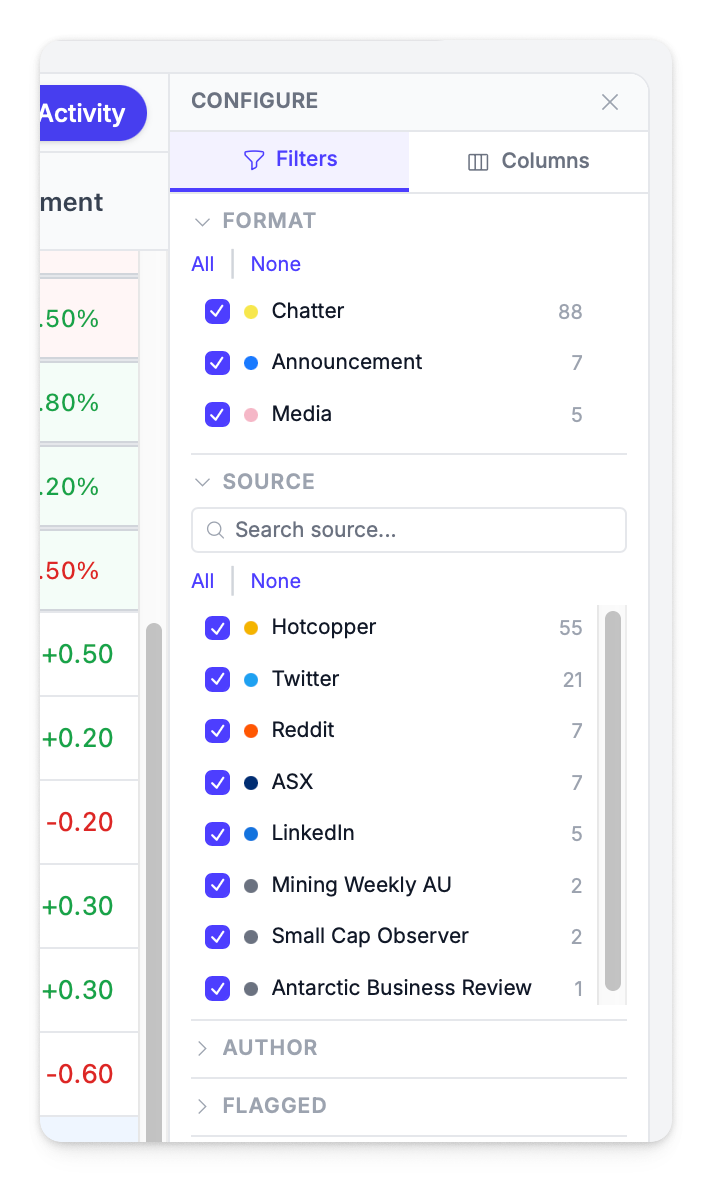
| Filter | Options |
|---|---|
| Format | Announcement, Chatter, Media, Broadcast, Manual |
| Source | Any tracked platform |
| Author | Filter by specific author name |
| Flagged | Show only flagged activities |
| Price Sensitive | Show only activities marked as price sensitive |
| High Engagement | Show only activities with above-average engagement |
| Rumour | Show only activities flagged as potential rumours |
| Thread | Filter to thread-based discussions |
| Market Activity | Unusual or Very Unusual trading days (see Abnormal Returns) |
The sidebar also includes a Columns tab to toggle which columns are visible and reorder them.
Share Price vs Activity Chart
Toggle the chart view using the chart icon in the toolbar to overlay your share price with activity volume — the same chart available on the Dashboard, scoped to your current filters and date range.
Activity Details
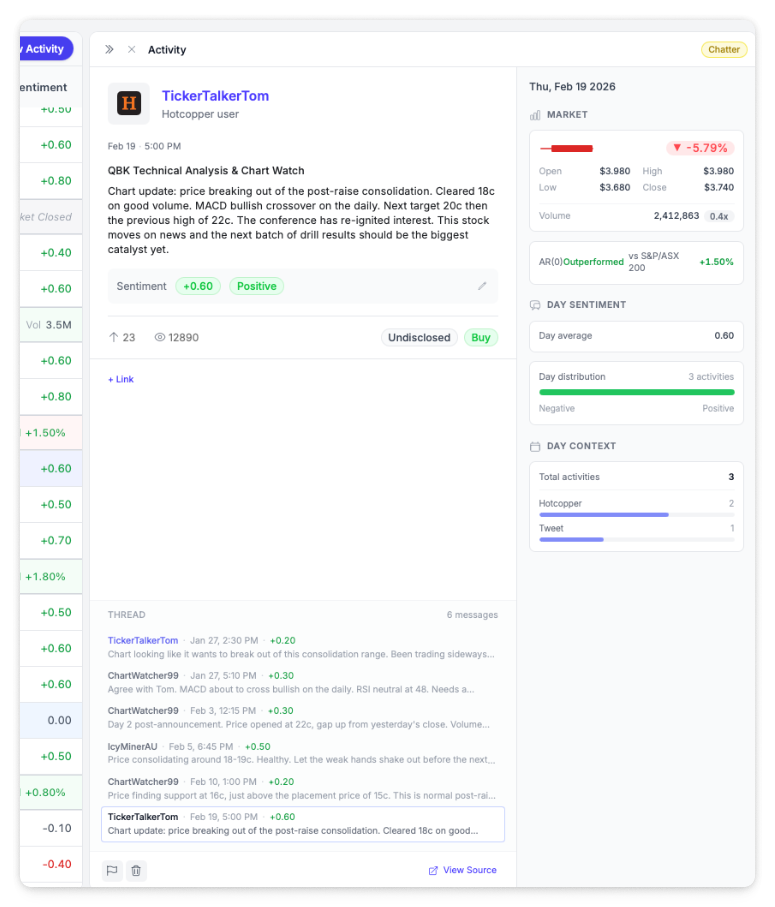
Click any activity to open the detail panel on the right side of the screen.
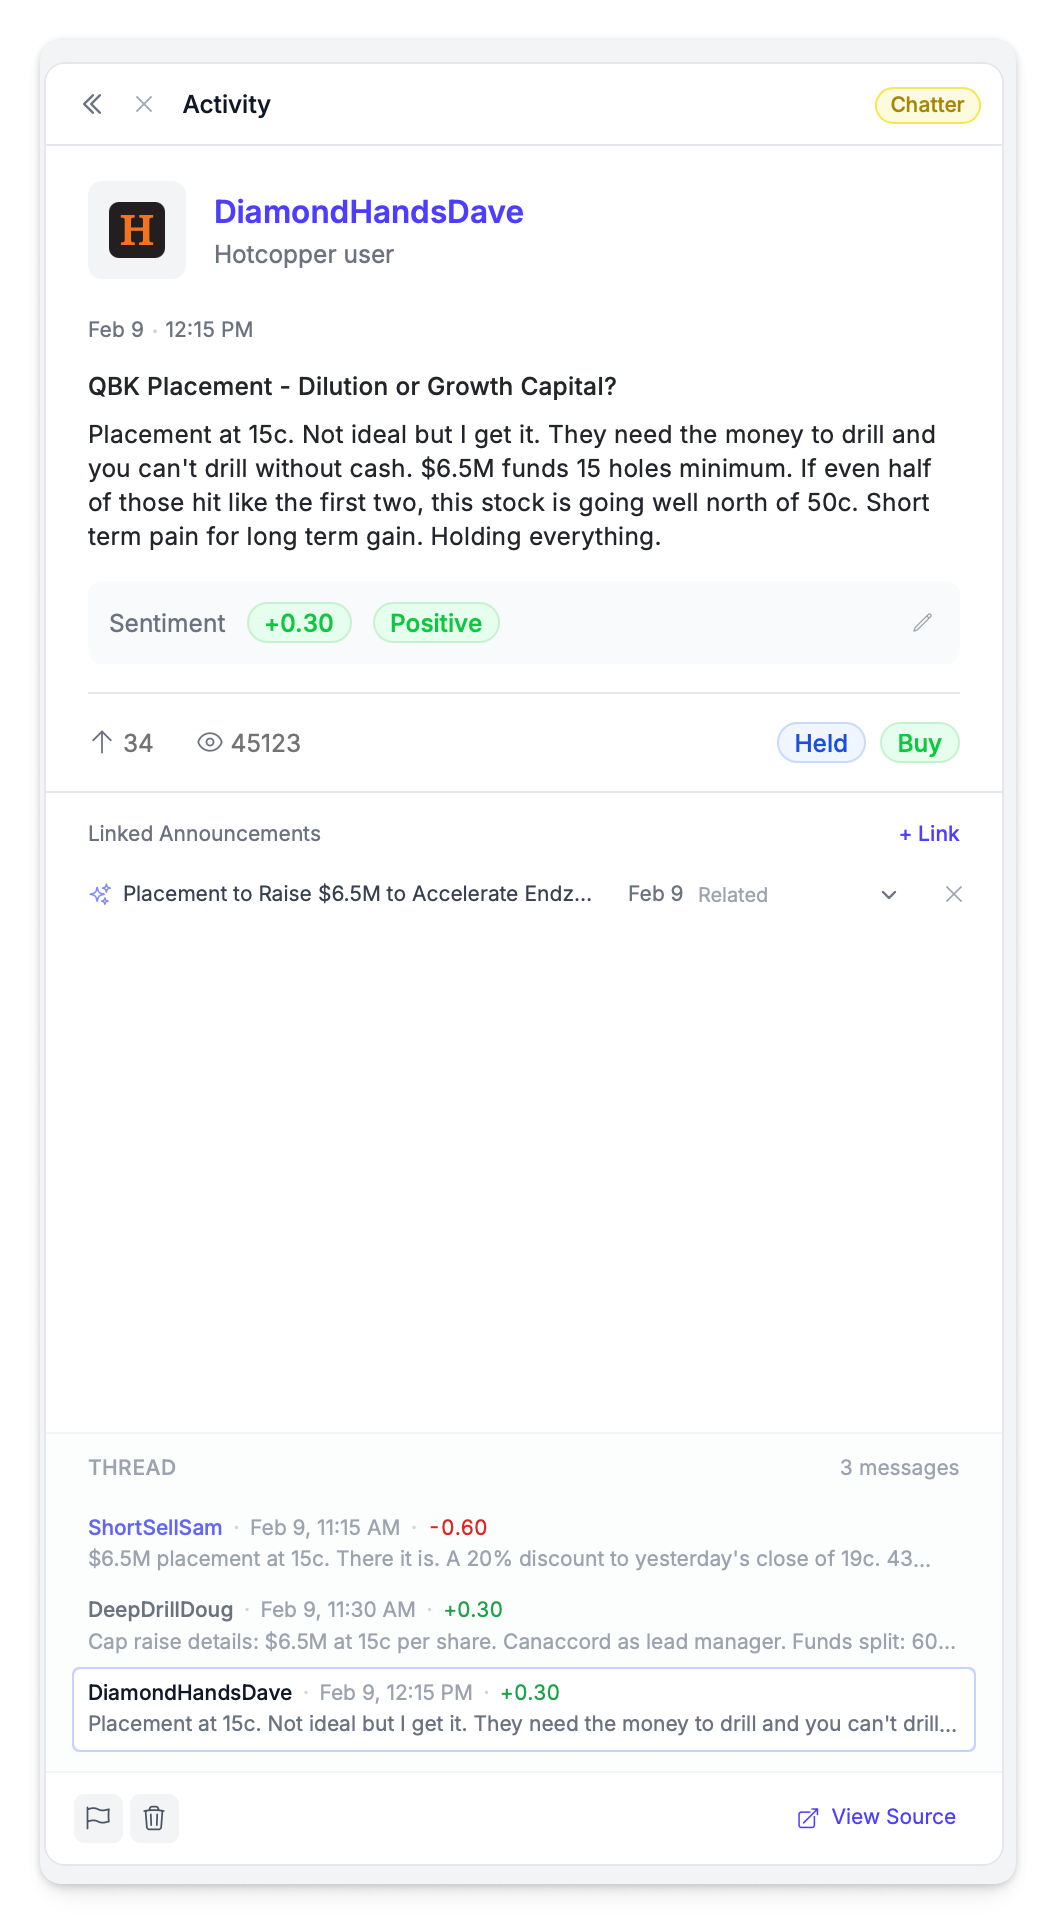
The detail panel shows:
- Full content with formatting preserved
- Author information and follower count
- Author badges — Frequent Author (fire icon) for high-volume posters, High Reach (megaphone icon) for top 10% by followers
- Engagement metrics — likes, views, comments, shares (varies by platform)
- Sentiment score with positive/negative/neutral label
- Posted date and link to original source
- Linked announcements (if connected to an ASX announcement)
- Thread — related replies and discussion (see Threads)
Use the arrow buttons at the top of the panel to navigate between activities without returning to the grid.
Engagement Metrics by Platform
| Platform | Metrics |
|---|---|
| Likes, Views, Engagement Rate | |
| Likes, Comments | |
| YouTube | Likes, Views, Comments |
| Forums | Likes, Thread Views |
| Score | |
| Mailchimp | Emails Sent, Open Rate, Click Rate |
Expanded Activity View
For a more detailed look at an activity and its surrounding conversation, click the expand icon to open the full expanded view.
The expanded view provides:
- Full content without truncation — the complete post, article, or announcement
- Complete thread below the activity, showing all replies and discussion in full
- Engagement metrics and sentiment in a more spacious layout
- Navigation between activities using the sidebar sentiment chart on the left
This view is particularly useful for long-form content like news articles, ASX announcements, or forum posts with extensive discussion threads.
Generate Summary
The Generate Summary button in the toolbar uses AI to produce a summary of the activities currently visible in your grid. This is useful when reviewing a busy period and you want a quick overview of what happened.
- Apply any filters or date range to narrow the activities you want summarised
- Click Generate Summary in the toolbar
- The AI analyses the visible activities and generates a written summary covering key themes, sentiment trends, and notable items
Filter to a specific date range or source before generating a summary to get more focused, actionable insights.
Threads
A thread is a group of related messages in a single conversation — for example, replies to a forum post, comments on a tweet, or responses in a Reddit discussion.
How Threads Display
In the grid, thread replies are grouped under their parent post with a purple styling accent. A thread count badge (e.g., "6 messages") shows how much discussion an activity generated.
When an activity has replies or responses, the detail panel shows a Thread section below the main content. Each thread message shows:
| Field | Description |
|---|---|
| Author | Who posted the reply |
| Date | When the reply was posted |
| Sentiment | Sentiment score for that individual reply |
| Preview | First line of the reply content |
Viewing Threads
- Click an activity in the grid to open the detail panel
- Scroll down to the Thread section to see all replies
- Click any thread message to read the full reply
- Use the Thread filter in the filter panel to show only activities that have threads
Thread depth is a strong signal of engagement. An activity with a long thread often indicates a topic that resonated with your audience — or one that sparked debate.
Bulk Actions
Select multiple activities using the checkboxes in the grid to perform bulk actions:
| Action | What It Does |
|---|---|
| Flag | Marks selected activities for follow-up — visible to all users on your account |
| Archive | Hides selected activities from the default view while retaining all data |
| Export Selected | Export only the selected activities to CSV |
A selection badge in the toolbar shows how many activities are currently selected.
Flagging Activities
Flag activities to mark them for follow-up, highlight them for your team, or track items that need attention. Flagged activities are visually marked in the grid, can be filtered using the Flagged filter, and automatically appear in the Flagged Activities section of your Board Report.
How to Flag
- Click the flag icon on any activity row in the grid to toggle the flag on or off
- Or select multiple activities and use the bulk Flag action
- Flags are visible to all users on your company account
Filtering by Flagged
Open the filter panel and expand the Flagged section to show only flagged activities. This is useful for:
- Building a shortlist of activities to discuss in a team meeting
- Tracking items that need a response or follow-up
- Reviewing what will appear in the Flagged Activities section of your next board report
Editing Sentiment
Quarterback automatically scores the sentiment of every activity on a scale from -1 (negative) to +1 (positive). If the AI gets it wrong, you can manually correct the score. Your corrections also help improve future sentiment analysis.
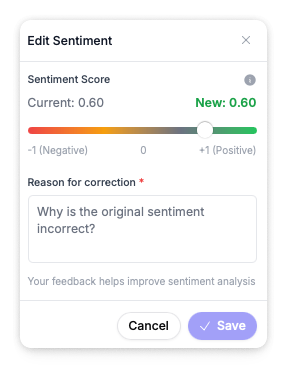
How to Edit Sentiment
- Open the activity detail panel by clicking on an activity
- Click the sentiment score to open the Edit Sentiment dialog
- Drag the slider to set the corrected score — the current and new values are shown side by side
- Enter a Reason for correction (required) — explain why the original sentiment is incorrect
- Click Save
The corrected sentiment replaces the original score across all views, including the grid, dashboard charts, and reports.
Your feedback helps improve sentiment analysis. Each correction is used to train the model, so the more corrections you make, the more accurate automated scoring becomes for your company's context.
Archiving Activities
Archive activities to remove them from your default view without permanently deleting them. Archived activities are hidden from the grid but remain in the system and can be restored at any time.
How to Archive
- Select one or more activities in the grid, then click Archive in the bulk action bar
- Archived activities are removed from the default grid view immediately
Viewing Archived Activities
Open the filter panel and expand the Archived filter to include archived activities in the grid. This lets you review or restore items you previously archived.
Archiving does not delete data. Archived activities do not contribute to historical analytics or sentiment trend reports. They can be unarchived at any time to restore them to the default grid view.
Exporting Activities
Export your activities to CSV for offline analysis, reporting, or sharing with stakeholders who don't have Quarterback access.
How to Export
- Apply any filters or date range to narrow the activities you want to export
- Click the Export button in the toolbar to export all visible activities, or select specific activities and use Export Selected
- The CSV file downloads as
activities-YYYY-MM-DD.csv
What's Included
The export includes all visible columns and metadata for each activity:
- Date and time
- Source and author
- Content preview
- Sentiment score
- Format
- Engagement metrics
- Flagged status
- Linked announcement (if any)
Apply filters before exporting to get exactly the data you need. For example, filter to a specific date range and source to export only Reddit activity from the past month.
Linking Activities to Announcements
Activities can be connected to ASX Announcements to track how announcements drive conversation and coverage. See Linked Activity Relationships for how auto-matching works.
Relationship Types
| Type | Meaning |
|---|---|
| Related | General related content |
| Broadcast | Official company communication |
| Coverage | Organic news coverage |
| Promotion | Paid promotional content |
| Auto-post | AI-generated or automated content |
How to Link an Activity
The platform auto-matches activities to announcements based on timing and keyword overlap, but you can also link manually:
- Open the activity detail panel by clicking on an activity
- Click + Link at the bottom of the detail panel
- Search for or select the announcement to link to
- Choose the relationship type
- Save
You can also link from the other direction — open an announcement and click Link Activities to attach activities to it. See Announcements for details.
Adding Manual Activities
You can add activities that aren't automatically captured — calls, meetings, presentations, events, or content from platforms not yet integrated. Click + New Activity in the toolbar to get started.
See Adding Activities for full details on each activity type and the fields available.