Announcement Reports
Turn announcement data into shareable reports — combining market impact, sentiment analysis, AI insights, and linked activity breakdowns in a single document.
Generating a Report
From a Single Announcement
- Click an announcement to open the detail panel
- Click Print Report in the panel footer
- The report opens in a new browser tab
From Multiple Announcements
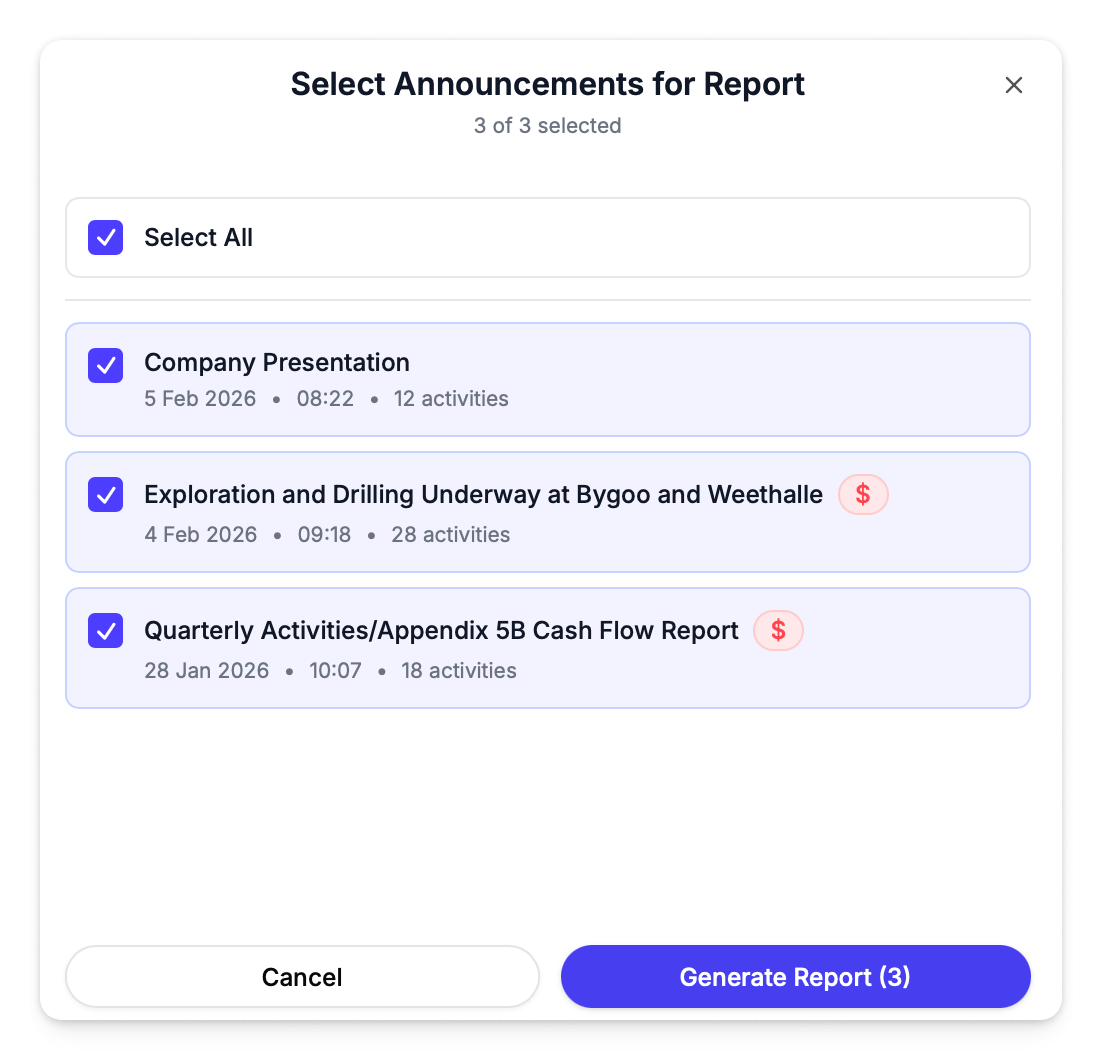
- Select announcements using checkboxes in the Announcements grid
- Click Export in the toolbar
- A selection modal appears — choose which announcements to include. Only announcements with linked activities are available for report generation
- Click Generate Report
- AI summaries are generated for each announcement (progress indicator shows completion)
- The report opens in a new browser tab
You can also generate a report for a single announcement this way — just select one from the modal.
The report opens as an HTML page in a new tab. Use the Print / Save as PDF button in the report sidebar to save a PDF copy via your browser's print dialog.
Report Contents
Each announcement in the report includes the following sections:
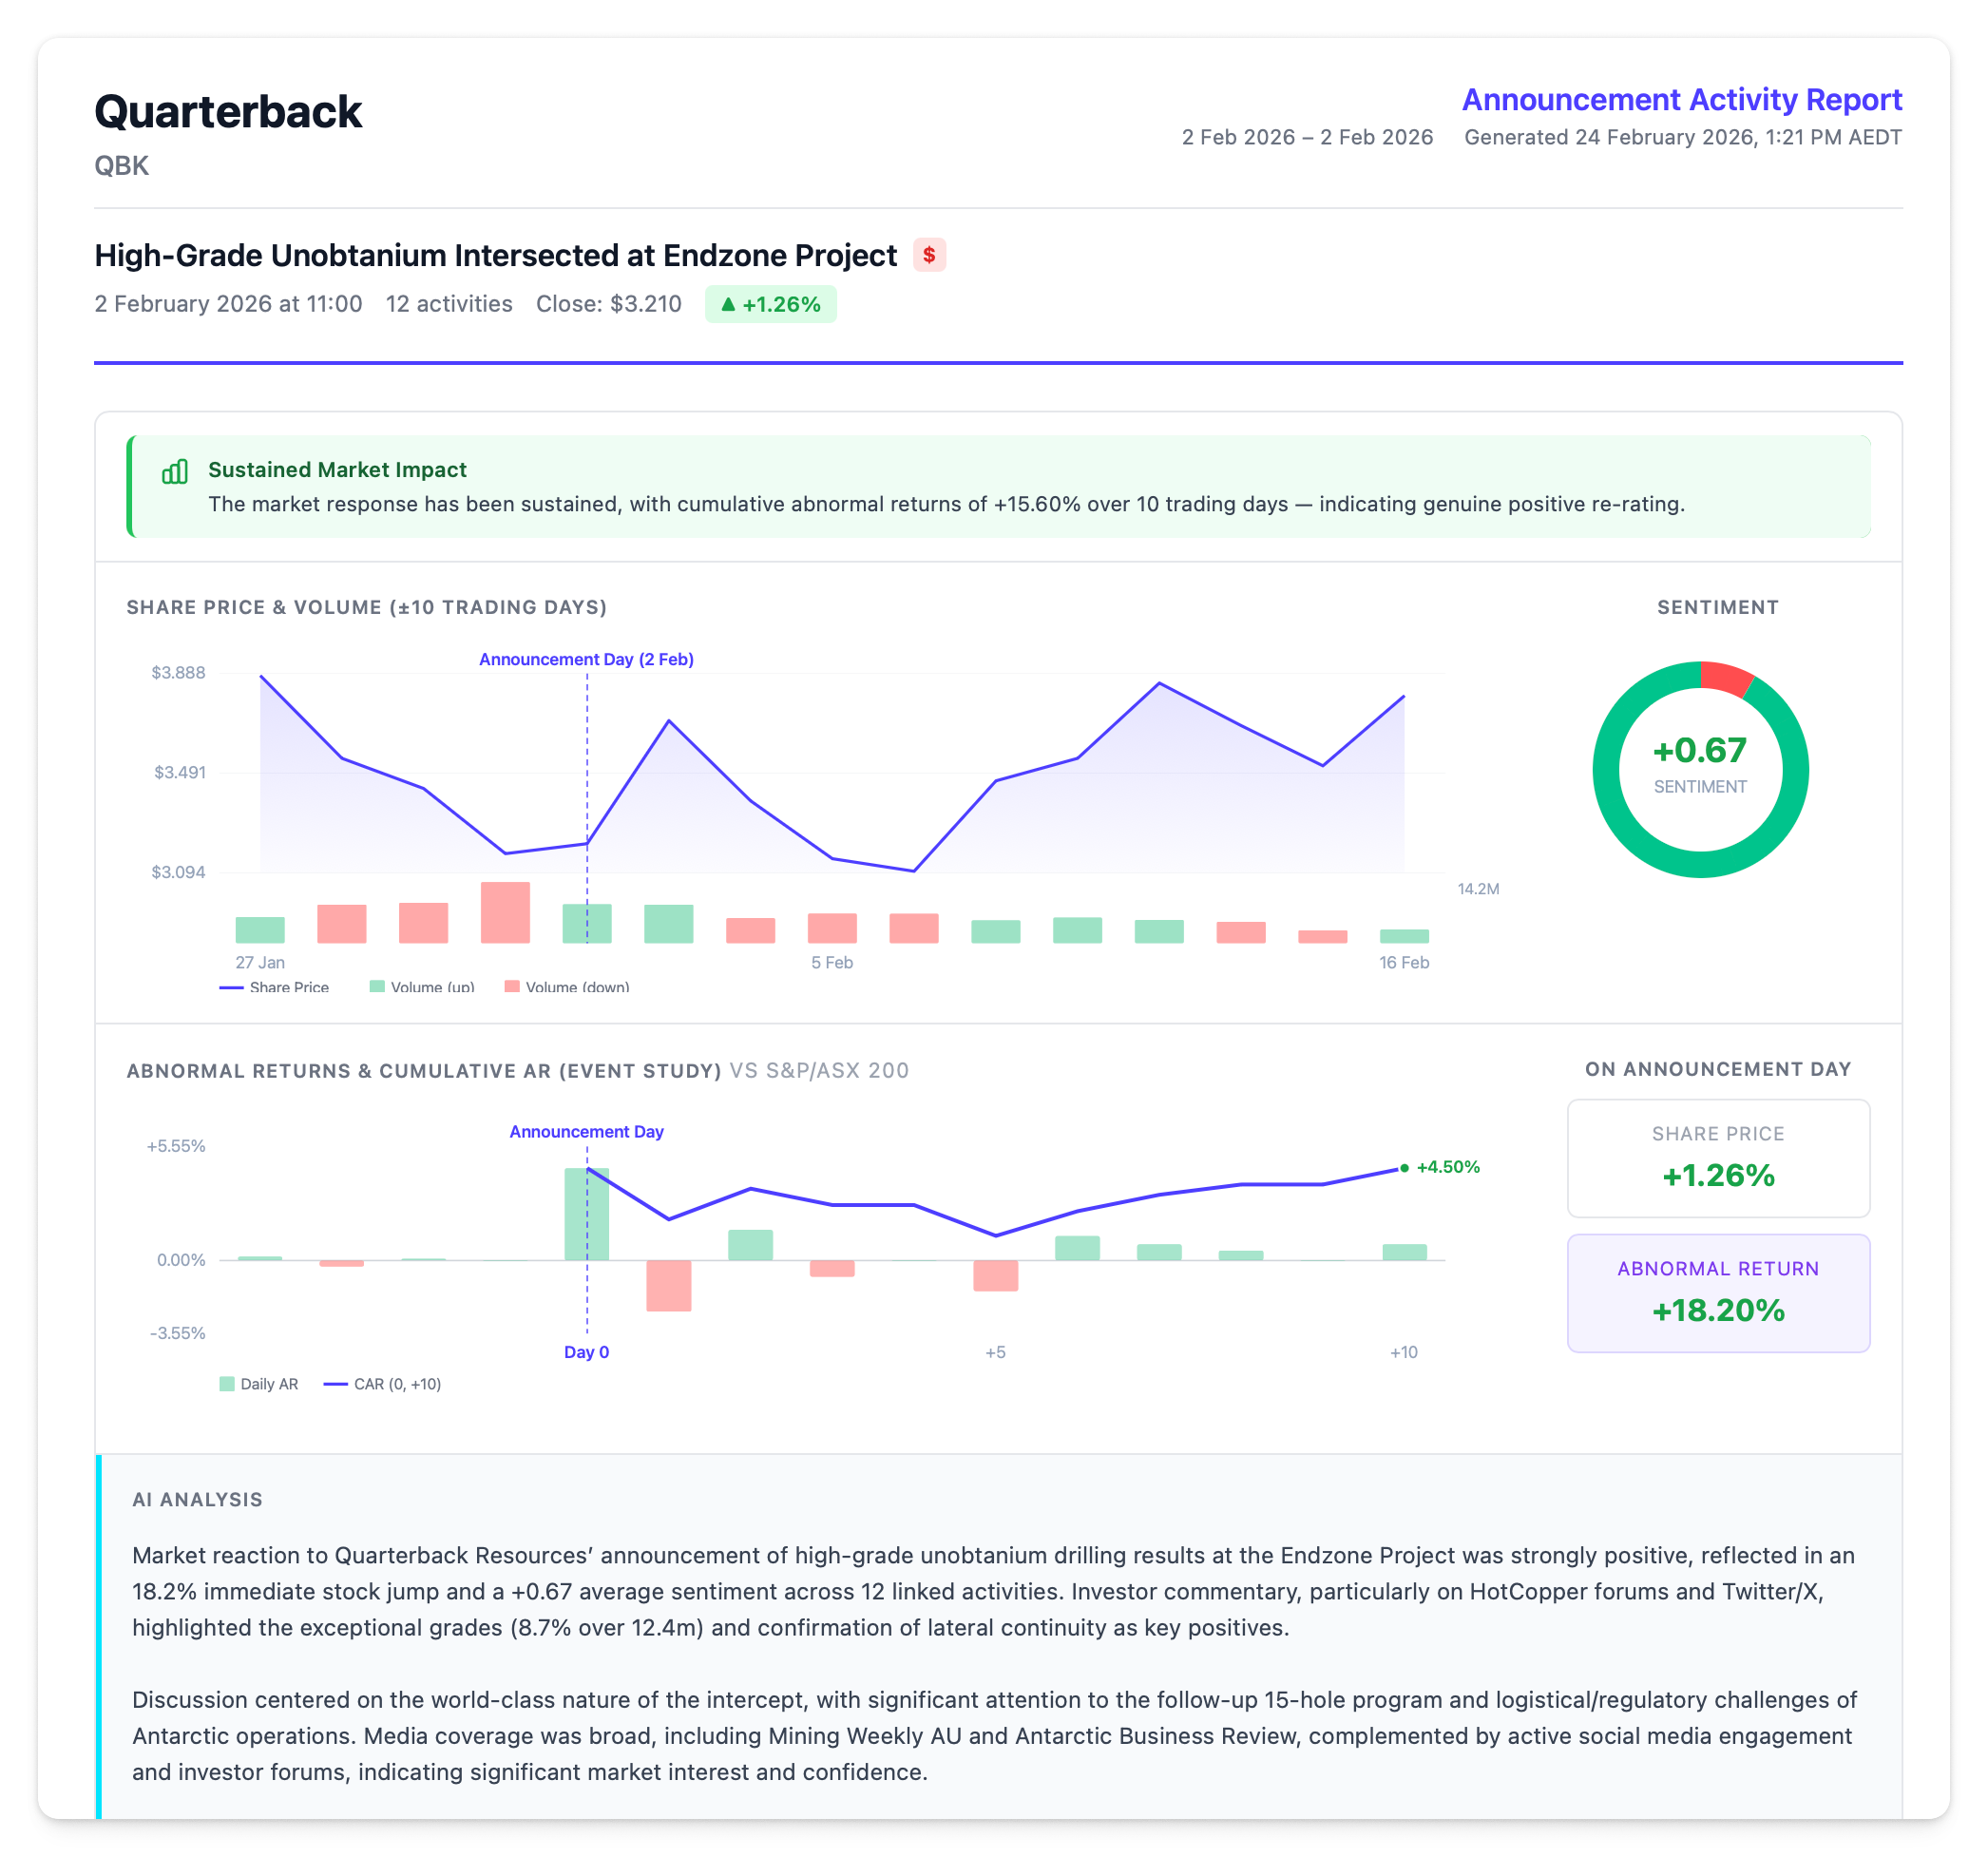
Executive Insights
Contextual alert cards that surface key findings:
| Insight | When It Appears |
|---|---|
| Sentiment-Price Divergence | Community sentiment direction contradicts the share price movement |
| Pre-Announcement Signal | Abnormal returns in the 3 days before the announcement show suspicious directional drift |
| Sustained Market Impact | CAR(0,+10) exceeds +2% or falls below -2% |
These only appear when conditions are met — if nothing unusual is detected, the section is empty.
Share Price & Volume Chart
An inline chart showing the share price and trading volume for 10 trading days either side of the announcement, with the announcement day marked.
Alongside the chart, a sentiment ring shows the positive / neutral / negative breakdown across linked activities, with the average sentiment score in the centre.
Event Study Chart
Abnormal return bars with a cumulative CAR line overlaid, spanning 10 days before and after the announcement. Beside the chart, three stat cards show:
- Share Price % — actual price change on announcement day
- Benchmark Return % — how the benchmark moved on the same day
- Abnormal Return — AR(0), the difference between actual and expected return
AI Analysis
An AI-generated summary (2–3 paragraphs) covering how the announcement was received, key themes from linked activities, and the breadth of coverage.
Linked Activities
Activities connected to the announcement, broken down by category:
| Category | What's Shown |
|---|---|
| Company Broadcasts | Official communications with engagement metrics (views, likes, comments). Mailchimp campaigns include emails sent, open rate, and click rate |
| Media Pickup | News articles and coverage with publisher name and publication time |
| Paid Distribution | Sponsored or promoted content |
| Community Discussion | Social posts and forum threads with aggregate stats (views, likes, comments, post count), a source breakdown chart, and a top authors chart coloured by sentiment |
Full Activity Table
A flat table of every linked activity with source, author, content preview, time, and sentiment score. Hidden by default — toggle it on from the sidebar.
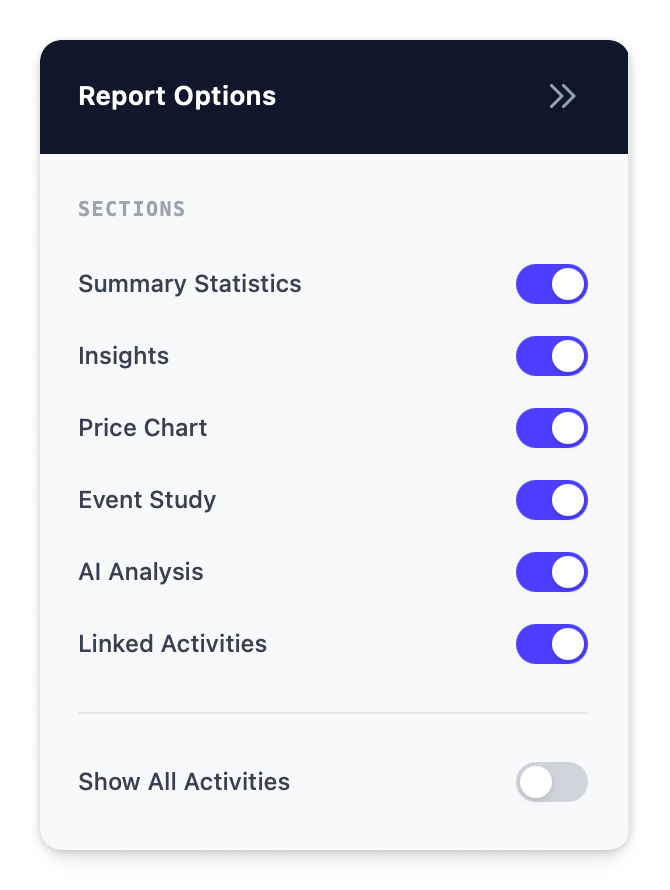
Customising the Report
A collapsible sidebar on the right side of the report lets you toggle sections on or off before printing:
| Toggle | Default |
|---|---|
| Summary Statistics | On (multi-announcement reports only) |
| Insights | On |
| Price Chart | On |
| Event Study | On |
| AI Analysis | On |
| Linked Activities | On |
| Show All Activities | Off |
Hidden sections are excluded from the printed output.
Saving as PDF
Click Print / Save as PDF in the sidebar to open your browser's print dialog.
Mac:
- In the print dialog, click the PDF dropdown in the bottom-left corner
- Select Save as PDF
- Choose a file name and location, then click Save
Windows:
- In the print dialog, change the Destination (or Printer) dropdown to Save as PDF or Microsoft Print to PDF
- Click Save (or Print)
- Choose a file name and location, then click Save
Multi-Announcement Reports
When generating a report from multiple announcements, the report includes a summary statistics grid at the top with four cards:
| Card | What It Shows |
|---|---|
| Total Announcements | Number of announcements in the report |
| Price Sensitive | How many are flagged as price-sensitive |
| Total Related Activities | Combined linked activity count |
| Avg Sentiment | Average sentiment across all linked activities |
Each announcement then appears as its own section with all the details above, sorted newest first.