Abnormal Returns
How the platform measures whether today's share price move was bigger than the market model expected — the foundation for spike detection, sustained-impact analysis, and leak detection.
What Is an Abnormal Return
Abnormal return is the difference between your stock's actual return and its expected return, calculated using the Capital Asset Pricing Model (CAPM) with a rolling estimation window. It eliminates the impact of wider market movements, letting you see whether today's performance is genuinely unusual.
Your stock's actual return minus the return you'd expect given how the benchmark moved that day. If the ASX 200 drops 3% and your stock drops 3%, that's expected — the abnormal return is ~0%. But if the ASX drops 3% and your stock drops 8%, the abnormal return is about -5%.
AR is not a direct comparison. A stock can fall less than the benchmark in absolute terms and still post a negative AR if its sensitivity (β) to that benchmark is low. Example: a stock with β = 0.05 to gold has a very weak relationship to it — CAPM expects almost no movement when gold moves. So a -6% drop on a day when gold falls -11.4% produces an AR of about -5%, because the stock fell much more than CAPM expected given its weak link to gold. The benchmark fell harder, but that doesn't help — the model didn't expect the stock to follow gold down anyway. See Correlation & Beta for how β is measured.
How AR Is Calculated
The expected return is calculated using CAPM, which factors in your stock's historical relationship with the market over a rolling estimation window.
| Symbol | Meaning |
|---|---|
| (alpha) | Stock's baseline return independent of the market |
| (beta) | Stock's sensitivity to market movements (from linear regression) |
| Benchmark return (default: ASX 200) | |
| Your stock's actual return on the day |
Identifying Unusual Days
The platform calculates a z-score for each day's AR to identify statistically unusual performance:
| Z-Score | Flag | Confidence |
|---|---|---|
| > +1.96 or < -1.96 | Positive/Negative spike | 95% confidence |
| > +3.0 or < -3.0 | Extreme positive/negative spike | 99.7% confidence |
| Between ±1.96 | No spike | Within normal range |
Spike flags appear on day-to-day markers throughout the activities chart, making it easy to spot unusual trading days at a glance.
To view only activities from unusual trading days, open the filters panel on the Activities page and select Unusual or Very Unusual from the Market Activity filter.
Configuring Your Benchmark
The benchmark you pick directly affects every AR calculation. Set it under:
Settings → Market → Benchmark Configuration
See Available Benchmarks for the full list of indices and commodities.
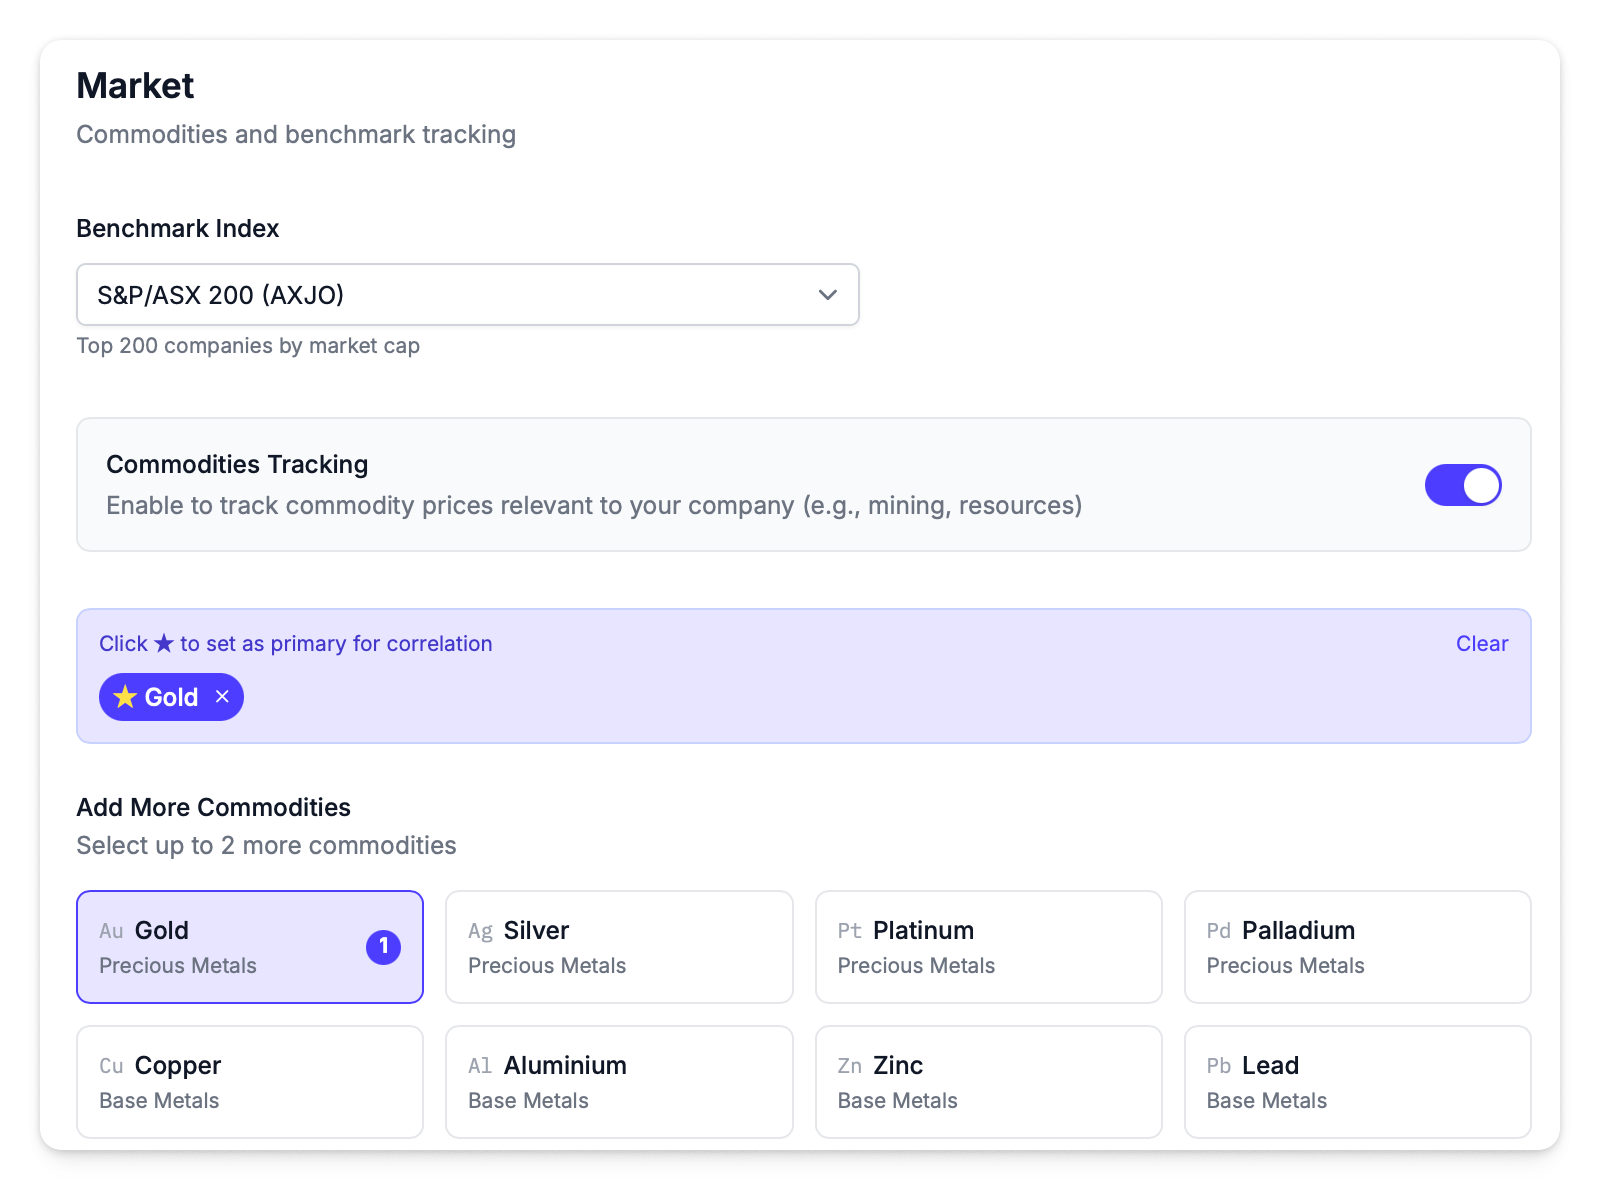
| Setting | Behaviour |
|---|---|
| Default | AXJO (ASX 200) |
| Index only | Uses selected index (e.g., XMJ for Materials) |
| Commodity only | Uses selected commodity (e.g., Gold) |
| Both selected | Commodity takes priority |
| Neither selected | Falls back to general market performance |
Each company can fully customise their benchmark. A gold miner might use Gold price. A diversified miner might use XMJ. A tech company might use AXAT.
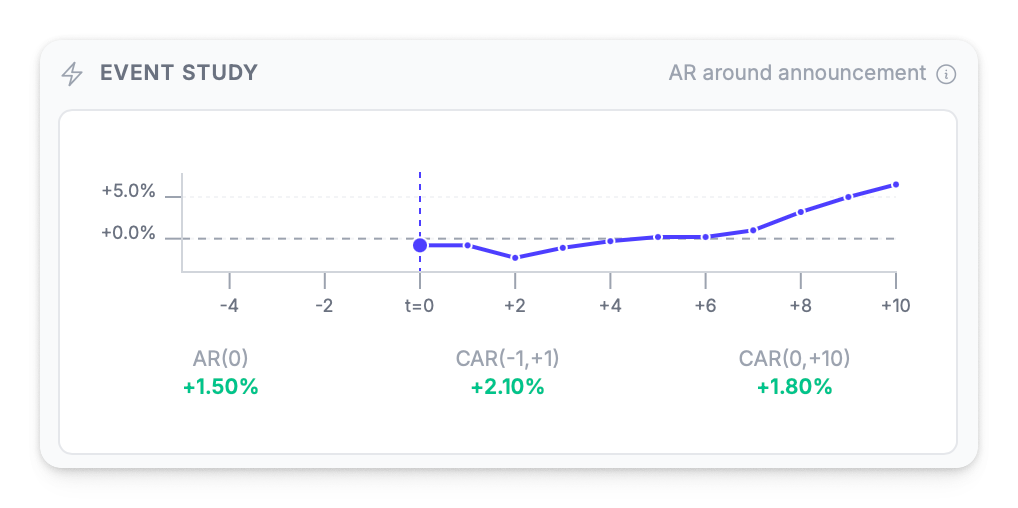
Cumulative Abnormal Returns (CAR)
Cumulative Abnormal Return accumulates AR results across an event study window. While AR tells you about a single day, CAR tells you whether an impact was sustained or just a "sugar hit."
Event Study Windows
The platform calculates CAR across multiple windows to capture different aspects of market reaction:
| Window | Notation | What It Shows |
|---|---|---|
| Announcement day | AR(0) | Immediate same-day reaction |
| Pre-announcement | CAR(-3,-1) | 3 days before announcement |
| Short window | CAR(-1,+1) | Day before through day after |
| Post-announcement | CAR(0,+10) | Announcement through 10 days after |
| Extended pre-window | CAR(-5,-1) | 5 days before announcement |
Interpreting CAR:
- Sustained positive CAR(0,+10) – Market views the news favourably; impact held
- Sustained negative CAR(0,+10) – Market views news unfavourably; impact held
- CAR returning to zero – Initial reaction was a sugar hit; market corrected
Compare CAR across announcements of the same category to understand which types drive sustained impact versus temporary spikes.
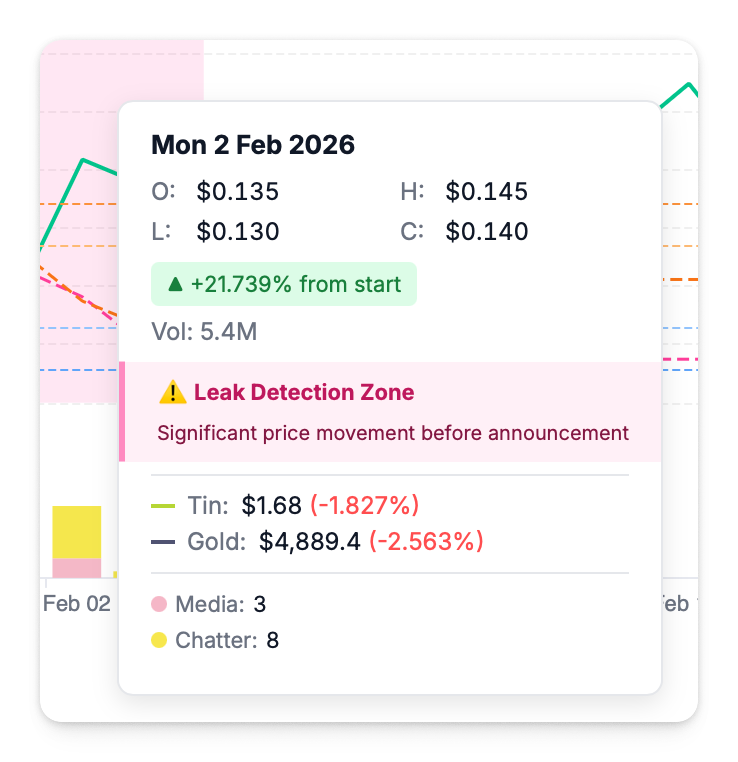
Leak Detection
CAR is also used for pre-announcement leak detection. The platform checks whether the pre-announcement window is "clean" (no other announcements) and looks at CAR(-3,-1) and CAR(-5,-1).
How it works:
- Calculate cumulative abnormal return in the 3–5 days leading up to an announcement
- Check if the pre-window is clean (no other company announcements in that period)
- If clean and there's significant CAR in the same direction as the announcement day, flag for investigation
A sharp rise before a positive announcement—or a sharp fall before negative news—in a clean pre-window may indicate information leaked before the official disclosure. This is an early warning for continuous disclosure compliance.
Example: If an announcement results in +5% AR(0), but the stock had already risen +3% CAR(-3,-1) with no other news in that window, that pattern warrants investigation.
How AR Fits With Other Metrics
| Metric | Question It Answers |
|---|---|
| AR | Did today's performance differ from what the market model predicted? |
| CAR | Did that reaction sustain across the event window, or fade? |
| CAR (pre-window) | Were there suspicious moves before the announcement? |
| Correlation & β | How tightly does the stock move with this benchmark in general? See Correlation & Beta. |
Use AR and CAR for event analysis (what happened on and around this day). Use correlation for market positioning (how does the market categorise us in general).