Benchmarking
Compare your share price performance against market indices and commodity prices.
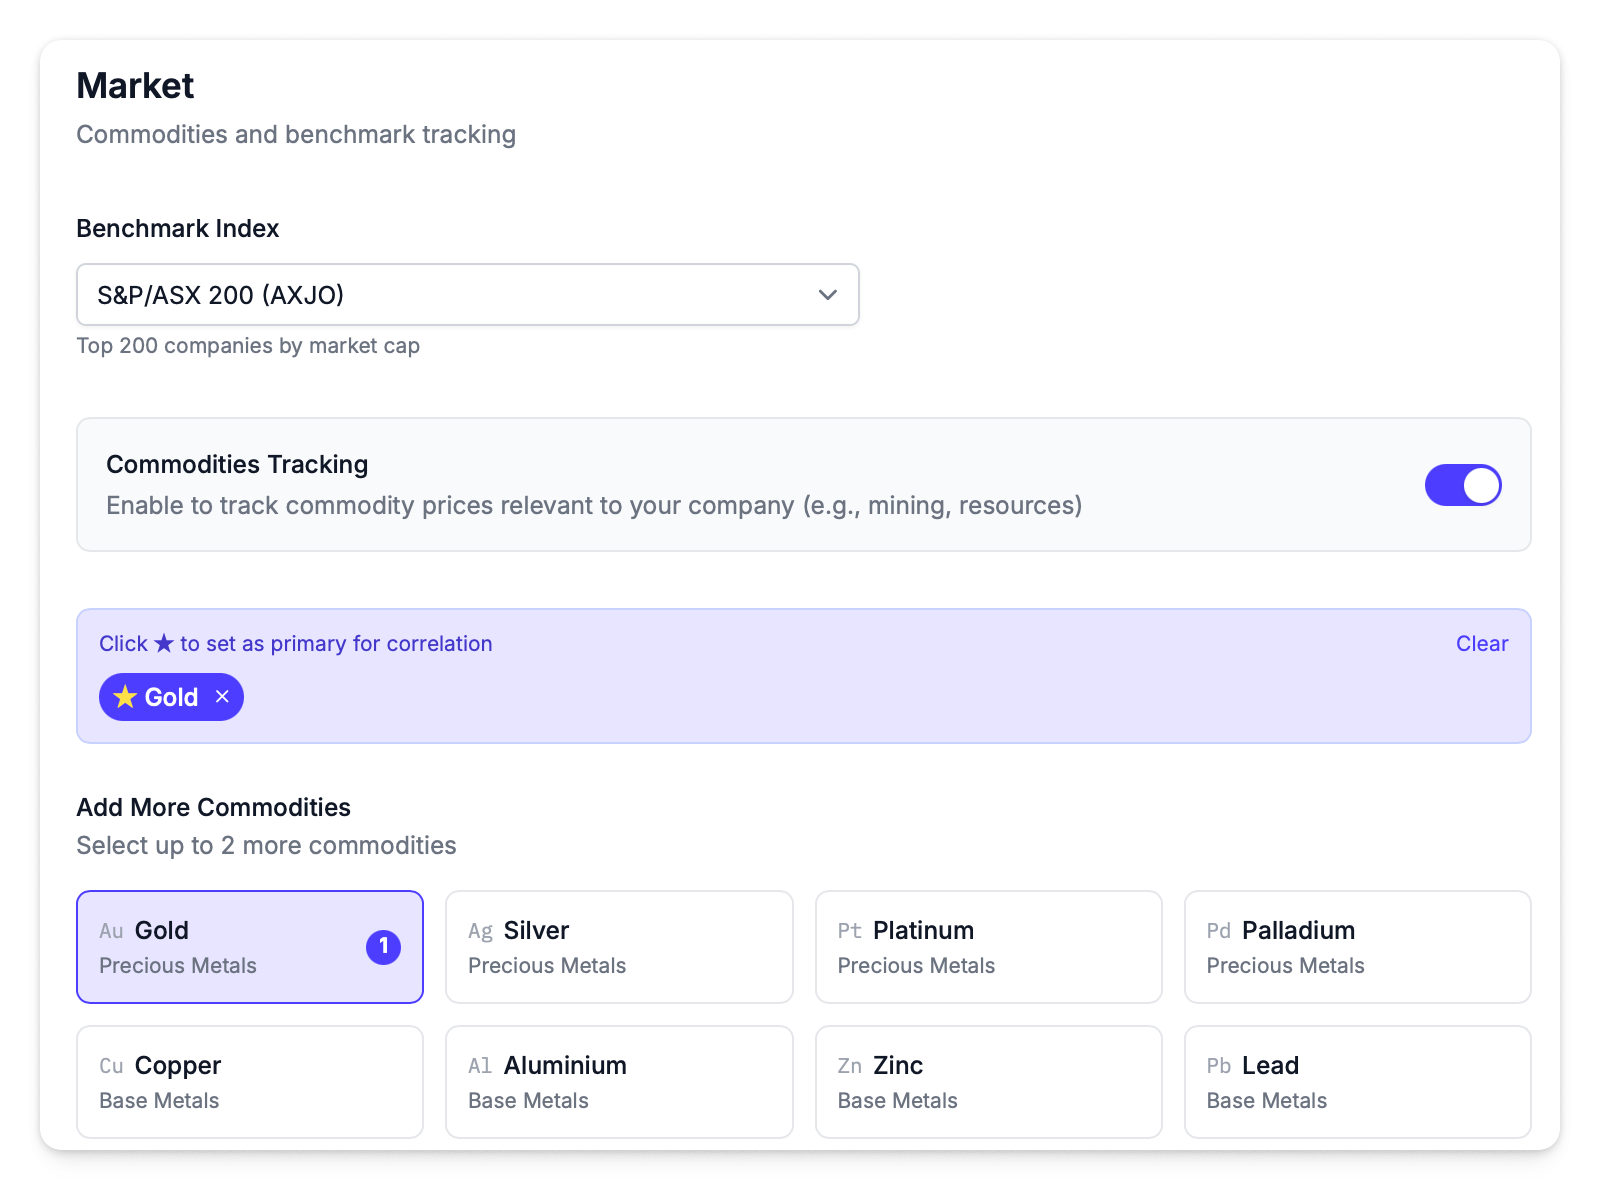
Your benchmark drives abnormal return calculations, correlation analysis, and the Stock vs Index chart on the dashboard. Choose a benchmark that reflects how your investors think about your company.
Settings → Market → Benchmark Configuration
Available Indices
Broad Market
| Index | Symbol | Description |
|---|---|---|
| S&P/ASX 200 | AXJO | Top 200 companies by market cap (default) |
| S&P/ASX All Ordinaries | XAO | Top 500 companies by market cap |
| S&P/ASX 200 Accumulation | XJO | ASX 200 with dividends reinvested |
| S&P/ASX 300 | AXKO | Top 300 companies by market cap |
Size-Based
| Index | Symbol | Description |
|---|---|---|
| S&P/ASX Small Ordinaries | AXSO | Small cap companies (201–300) |
| S&P/ASX MidCap 50 | AXMD | Mid cap companies (51–100) |
| S&P/ASX Emerging Companies | XEC | Emerging small cap companies |
Sector
| Index | Symbol | Description |
|---|---|---|
| S&P/ASX 200 Materials | AXMJ | Materials sector |
| S&P/ASX 200 Energy | AXEJ | Energy sector |
| S&P/ASX 200 Financials | AXFJ | Financials sector |
| S&P/ASX 200 Health Care | AXHJ | Health care sector |
| S&P/ASX 200 Industrials | AXIJ | Industrials sector |
| S&P/ASX 200 Information Technology | AXNJ | IT sector |
| S&P/ASX 200 A-REIT | AXPJ | Real estate investment trusts |
| S&P/ASX 200 Consumer Staples | AXSJ | Consumer staples sector |
| S&P/ASX 200 Consumer Discretionary | AXDJ | Consumer discretionary sector |
| S&P/ASX 200 Telecommunications | AXTJ | Telecommunications sector |
| S&P/ASX 200 Utilities | AXUJ | Utilities sector |
Thematic
| Index | Symbol | Description |
|---|---|---|
| S&P/ASX All Technology | AXAT | All technology companies |
| S&P/ASX All Ordinaries Gold | AXGD | Gold mining companies |
| S&P/ASX 300 Metals & Mining | XMM | Metals and mining companies |
| S&P/ASX 200 Resources | AXRE | Resources sector |
If your company operates across multiple sectors, choose the index that best represents how your investors benchmark you — not necessarily your GICS classification.
Available Commodities
Select up to three commodities relevant to your company. Featured commodities appear in the dashboard stats bar with live prices.
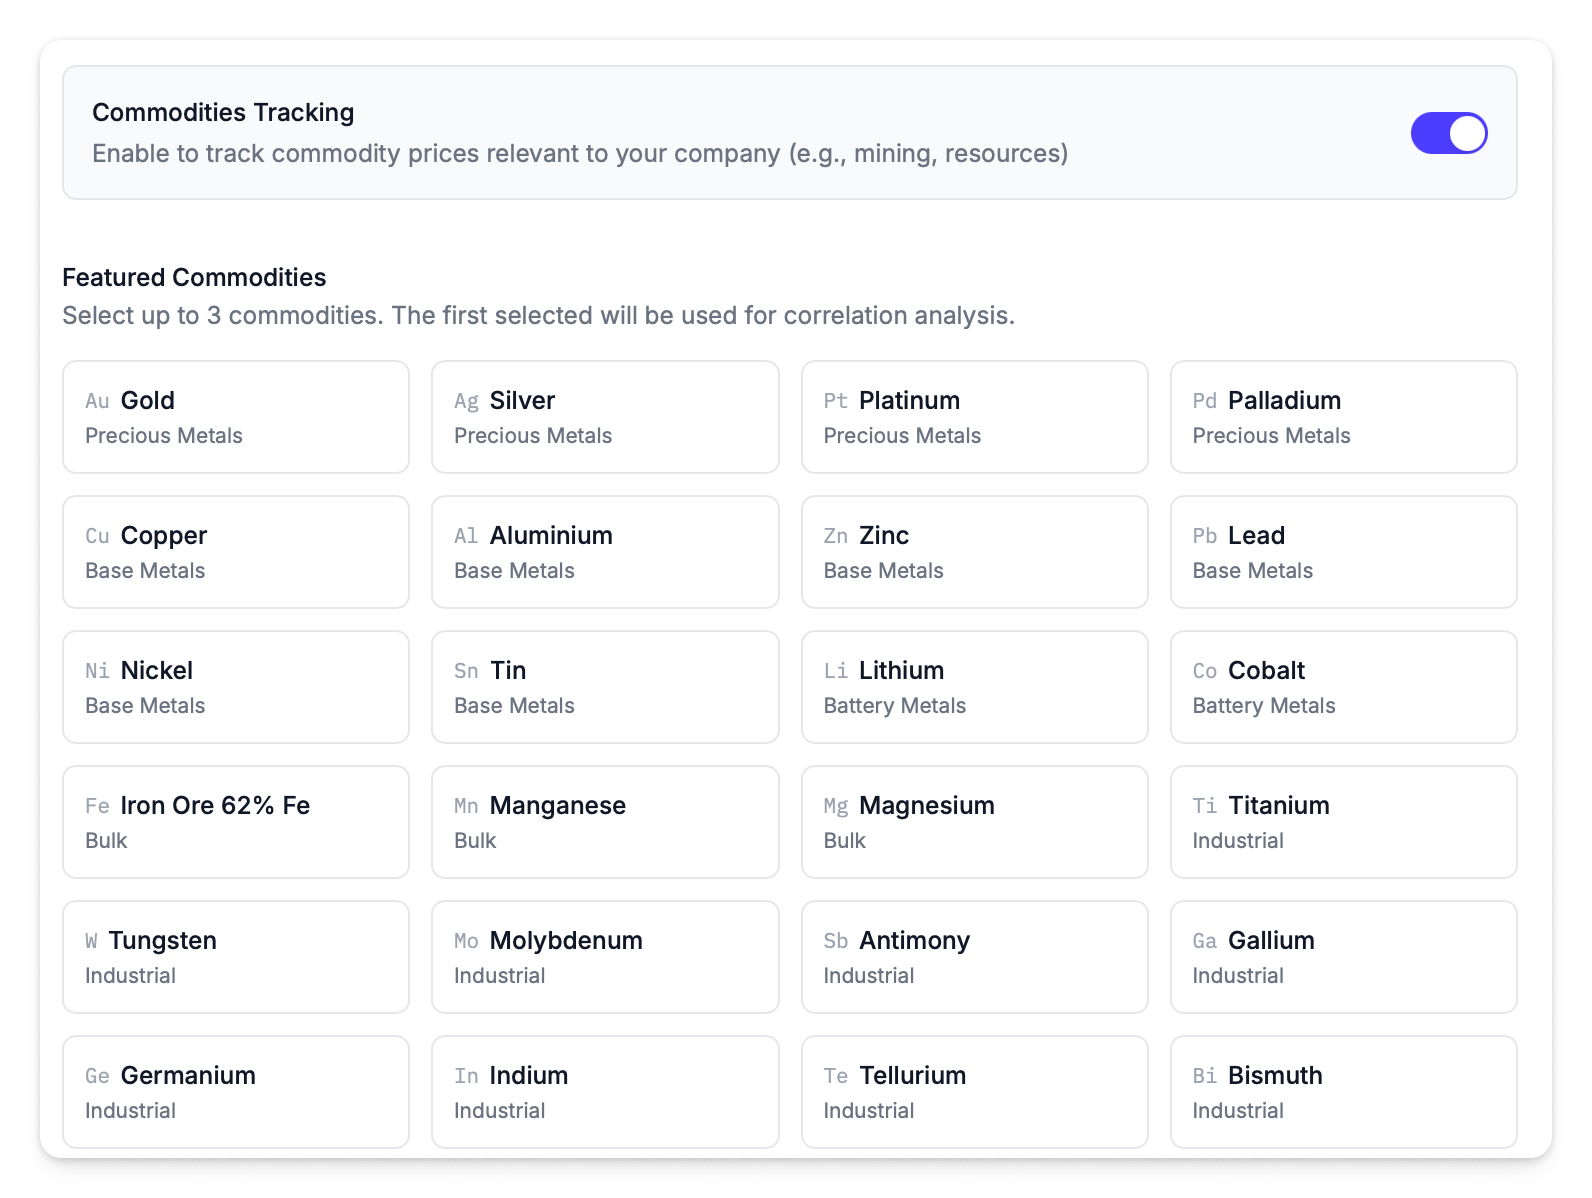
Precious Metals
| Commodity | Symbol | Unit |
|---|---|---|
| Gold | Au | per ounce |
| Silver | Ag | per ounce |
| Platinum | Pt | per ounce |
| Palladium | Pd | per ounce |
Base Metals
| Commodity | Symbol | Unit |
|---|---|---|
| Copper | Cu | per troy ounce |
| Aluminium | Al | per ton |
| Zinc | Zn | per ton |
| Lead | Pb | per ton |
| Nickel | Ni | per ton |
| Tin | Sn | per ton |
Battery Metals
| Commodity | Symbol | Unit |
|---|---|---|
| Lithium | Li | per ton |
| Cobalt | Co | per lb |
Bulk
| Commodity | Symbol | Unit |
|---|---|---|
| Iron Ore 62% Fe | Fe | per ton |
| Manganese | Mn | per ton |
| Magnesium | Mg | per ton |
Industrial
| Commodity | Symbol | Unit |
|---|---|---|
| Titanium | Ti | per lb |
| Tungsten | W | per ton |
| Molybdenum | Mo | per lb |
| Antimony | Sb | per ton |
| Gallium | Ga | per kg |
| Germanium | Ge | per kg |
| Indium | In | per kg |
| Tellurium | Te | per kg |
| Bismuth | Bi | per lb |
Nuclear
| Commodity | Symbol | Unit |
|---|---|---|
| Uranium | U | per lb |
Energy
| Commodity | Symbol | Unit |
|---|---|---|
| Australian Coal | C | per ton |
Fertilisers
| Commodity | Symbol | Unit |
|---|---|---|
| Phosphate | P | per ton |
| Potash Chloride | K | per ton |
Priority Selection
The order you select commodities sets their priority:
- Priority 1 – Primary commodity, displayed first, used as default in correlation analysis
- Priority 2 – Secondary commodity
- Priority 3 – Tertiary commodity
Choose based on what matters most to your investors. A gold miner would select Gold as priority 1. A battery materials producer might choose Lithium or Cobalt.
When commodities are enabled and a primary commodity is selected, it takes priority over the index for benchmark calculations. See Abnormal Returns for how benchmark priority works.