Broadcast Performance
The full record of every activity you've authored — emails, social posts, broadcasts — alongside the engagement they generated and the price impact they may have driven.
What It Is
Broadcasts is the view that shows everything authored by you. Where Activities is the full inbound feed — everything anyone is saying about your company — Broadcasts narrows to just your own outbound content: Mailchimp campaigns, Campaign Monitor sends, Twitter posts, LinkedIn updates, YouTube uploads, Facebook posts. It answers two questions: which broadcasts drove engagement, and did any of them move the share price?
All activities authored by you, in one place — with engagement metrics, follower growth, and a share price overlay so you can see what actually worked.
How to Get There
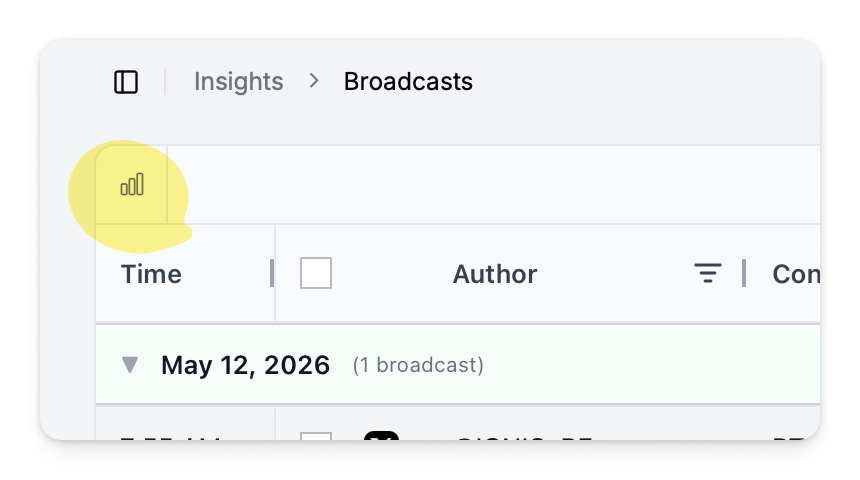
Insights → Broadcasts
Use the date range picker in the top-right of the page header to control the window for all metrics and charts.
Open the Performance Charts
Two performance charts live at the top of the page, hidden by default. Click Show charts in the toolbar to expand them. Click Hide charts to collapse them again.
When expanded:
| Chart | What It Shows |
|---|---|
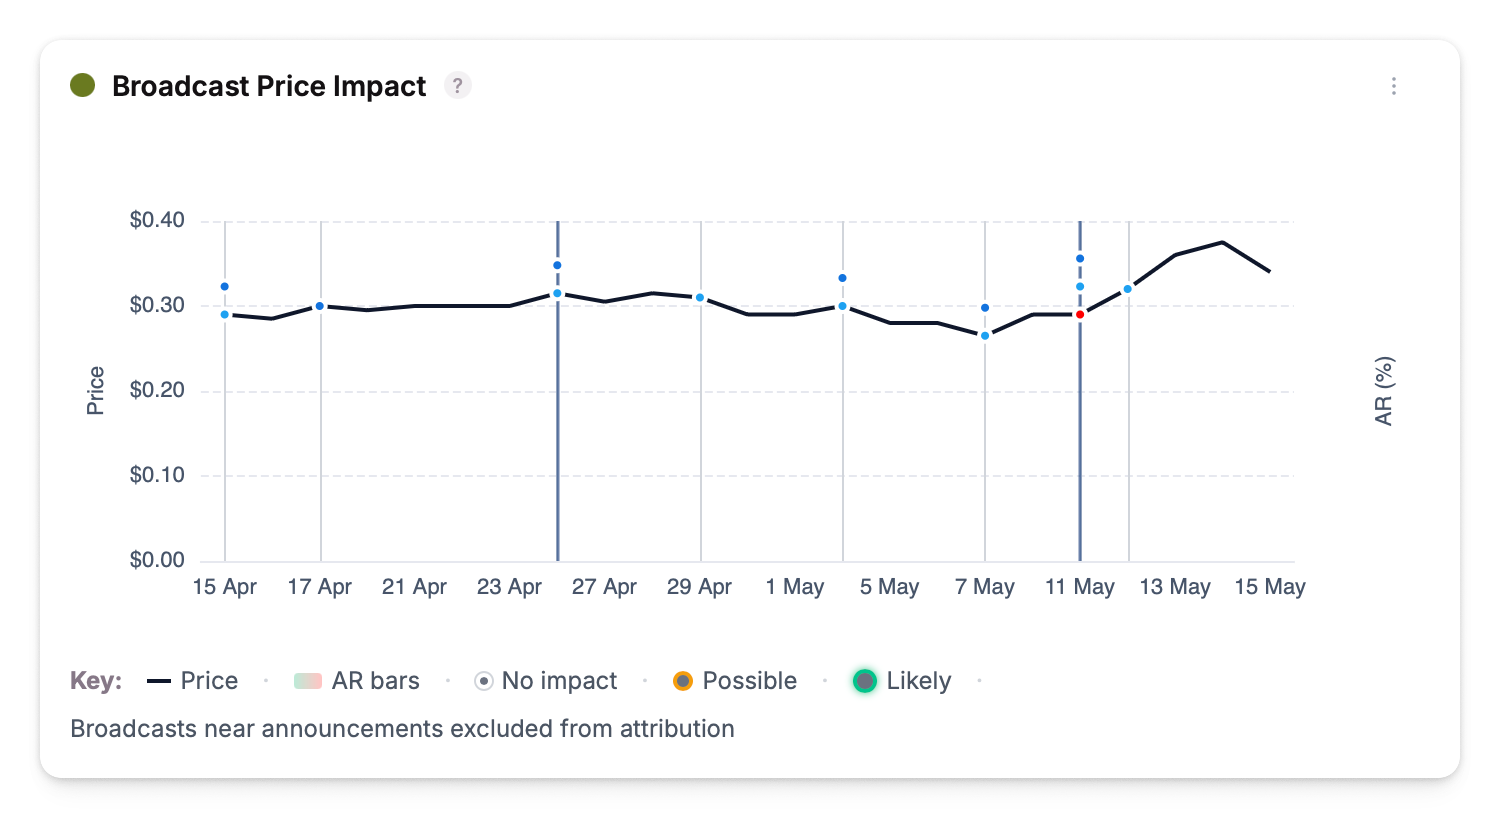
| Broadcast Price Impact | Your broadcasts plotted against the share price line. Helps you spot whether a campaign correlated with a price move. ASX announcements are marked on the chart in a dark vertical line, so you can separate broadcast impact from announcement impact. |
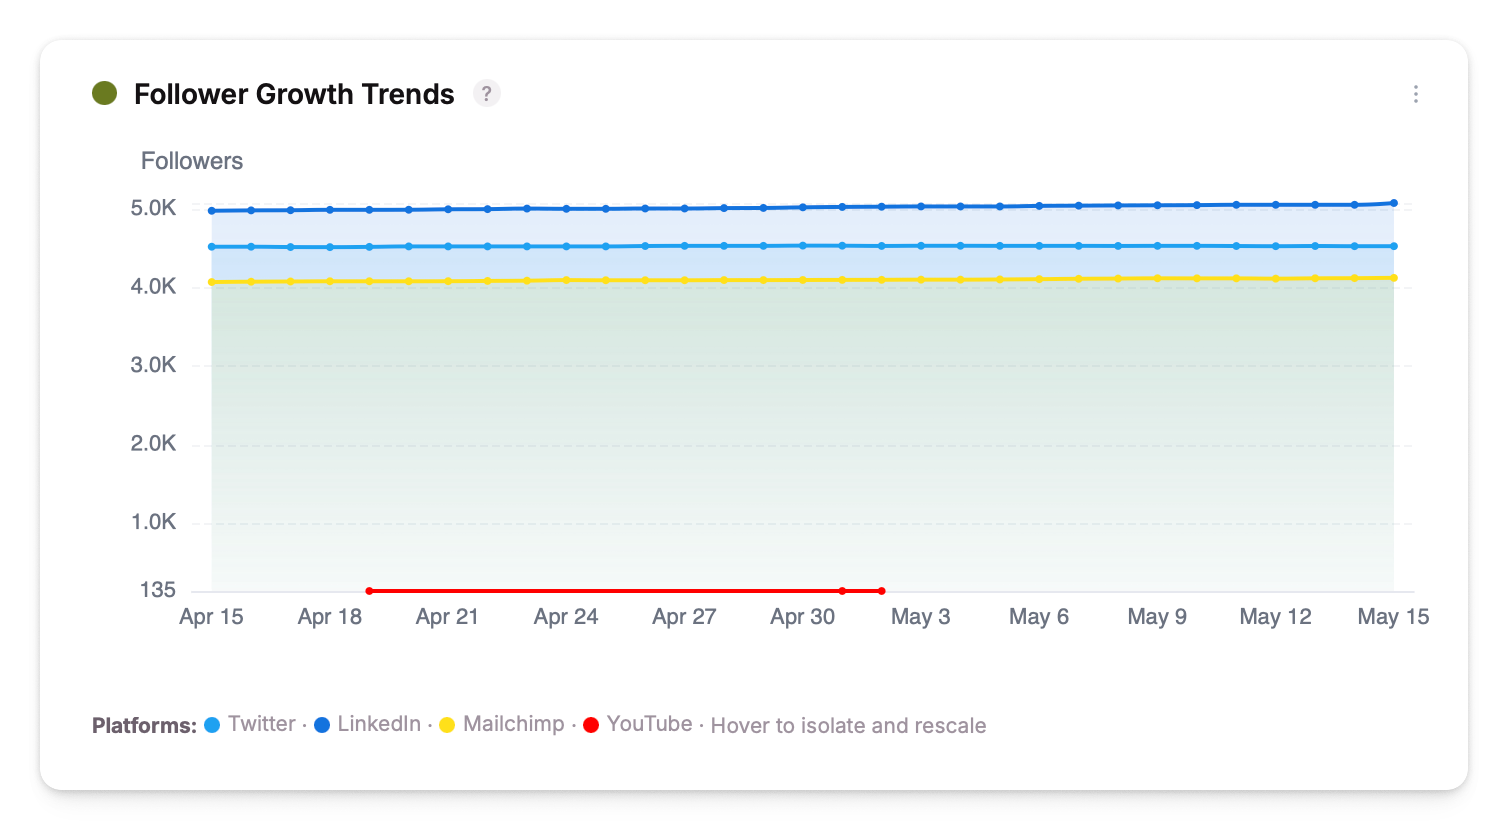
| Follower Growth Trends | Follower or subscriber counts over time, one line per connected platform (Twitter, LinkedIn, Mailchimp, Campaign Monitor, YouTube, Facebook). Hover over a platform name in the legend to isolate that channel's growth on the chart. |
The Broadcasts Grid
Below the charts is the data grid — every broadcast in the selected period, one row per activity. Each row shows the platform, post content, date sent, and the engagement metrics tracked for that platform.
Broadcasts performing above your rolling 90-day average for that source are highlighted with a trophy badge — a quick visual signal of what worked.
Filter by source
Open the filter panel from the toolbar to narrow to specific platforms.
| Filter | Options |
|---|---|
| Sources | contains / does not contain a list of platforms |
Click a broadcast for detail
Click any row to open the broadcast in a split panel on the right — full content, all engagement metrics for that platform, and the share price chart annotated with this broadcast highlighted.
Bulk actions
Select multiple broadcasts via the row checkboxes:
- Flag — mark for follow-up; flagged broadcasts appear in the Board Report
- Archive — hide from the default grid view
Connecting Your Channels
Twitter, LinkedIn, YouTube, and Facebook are pulled in via your connected social accounts. Email channels require a separate integration:
| Integration | What It Pulls | Setup |
|---|---|---|
| Mailchimp | Campaign sends, opens, click rates, subscriber counts | Mailchimp setup |
| Campaign Monitor | Campaign sends, opens, subscriber counts | Campaign Monitor setup |
If a platform you broadcast on is missing here, your activities from it won't appear in the grid until the integration is connected.
Print a Broadcast Report
Click Generate Report in the toolbar to open the Broadcast Report for the selected date range in a new tab — campaign performance, subscriber metrics, email analytics, and follower growth in a single shareable view. Use the browser print dialog to save as PDF.
The Broadcast Report is a comprehensive overview of your company-generated comms.